Wisconsin groups its school districts into Cooperative Educational Service Agencies, regional bodies that provide shared services.
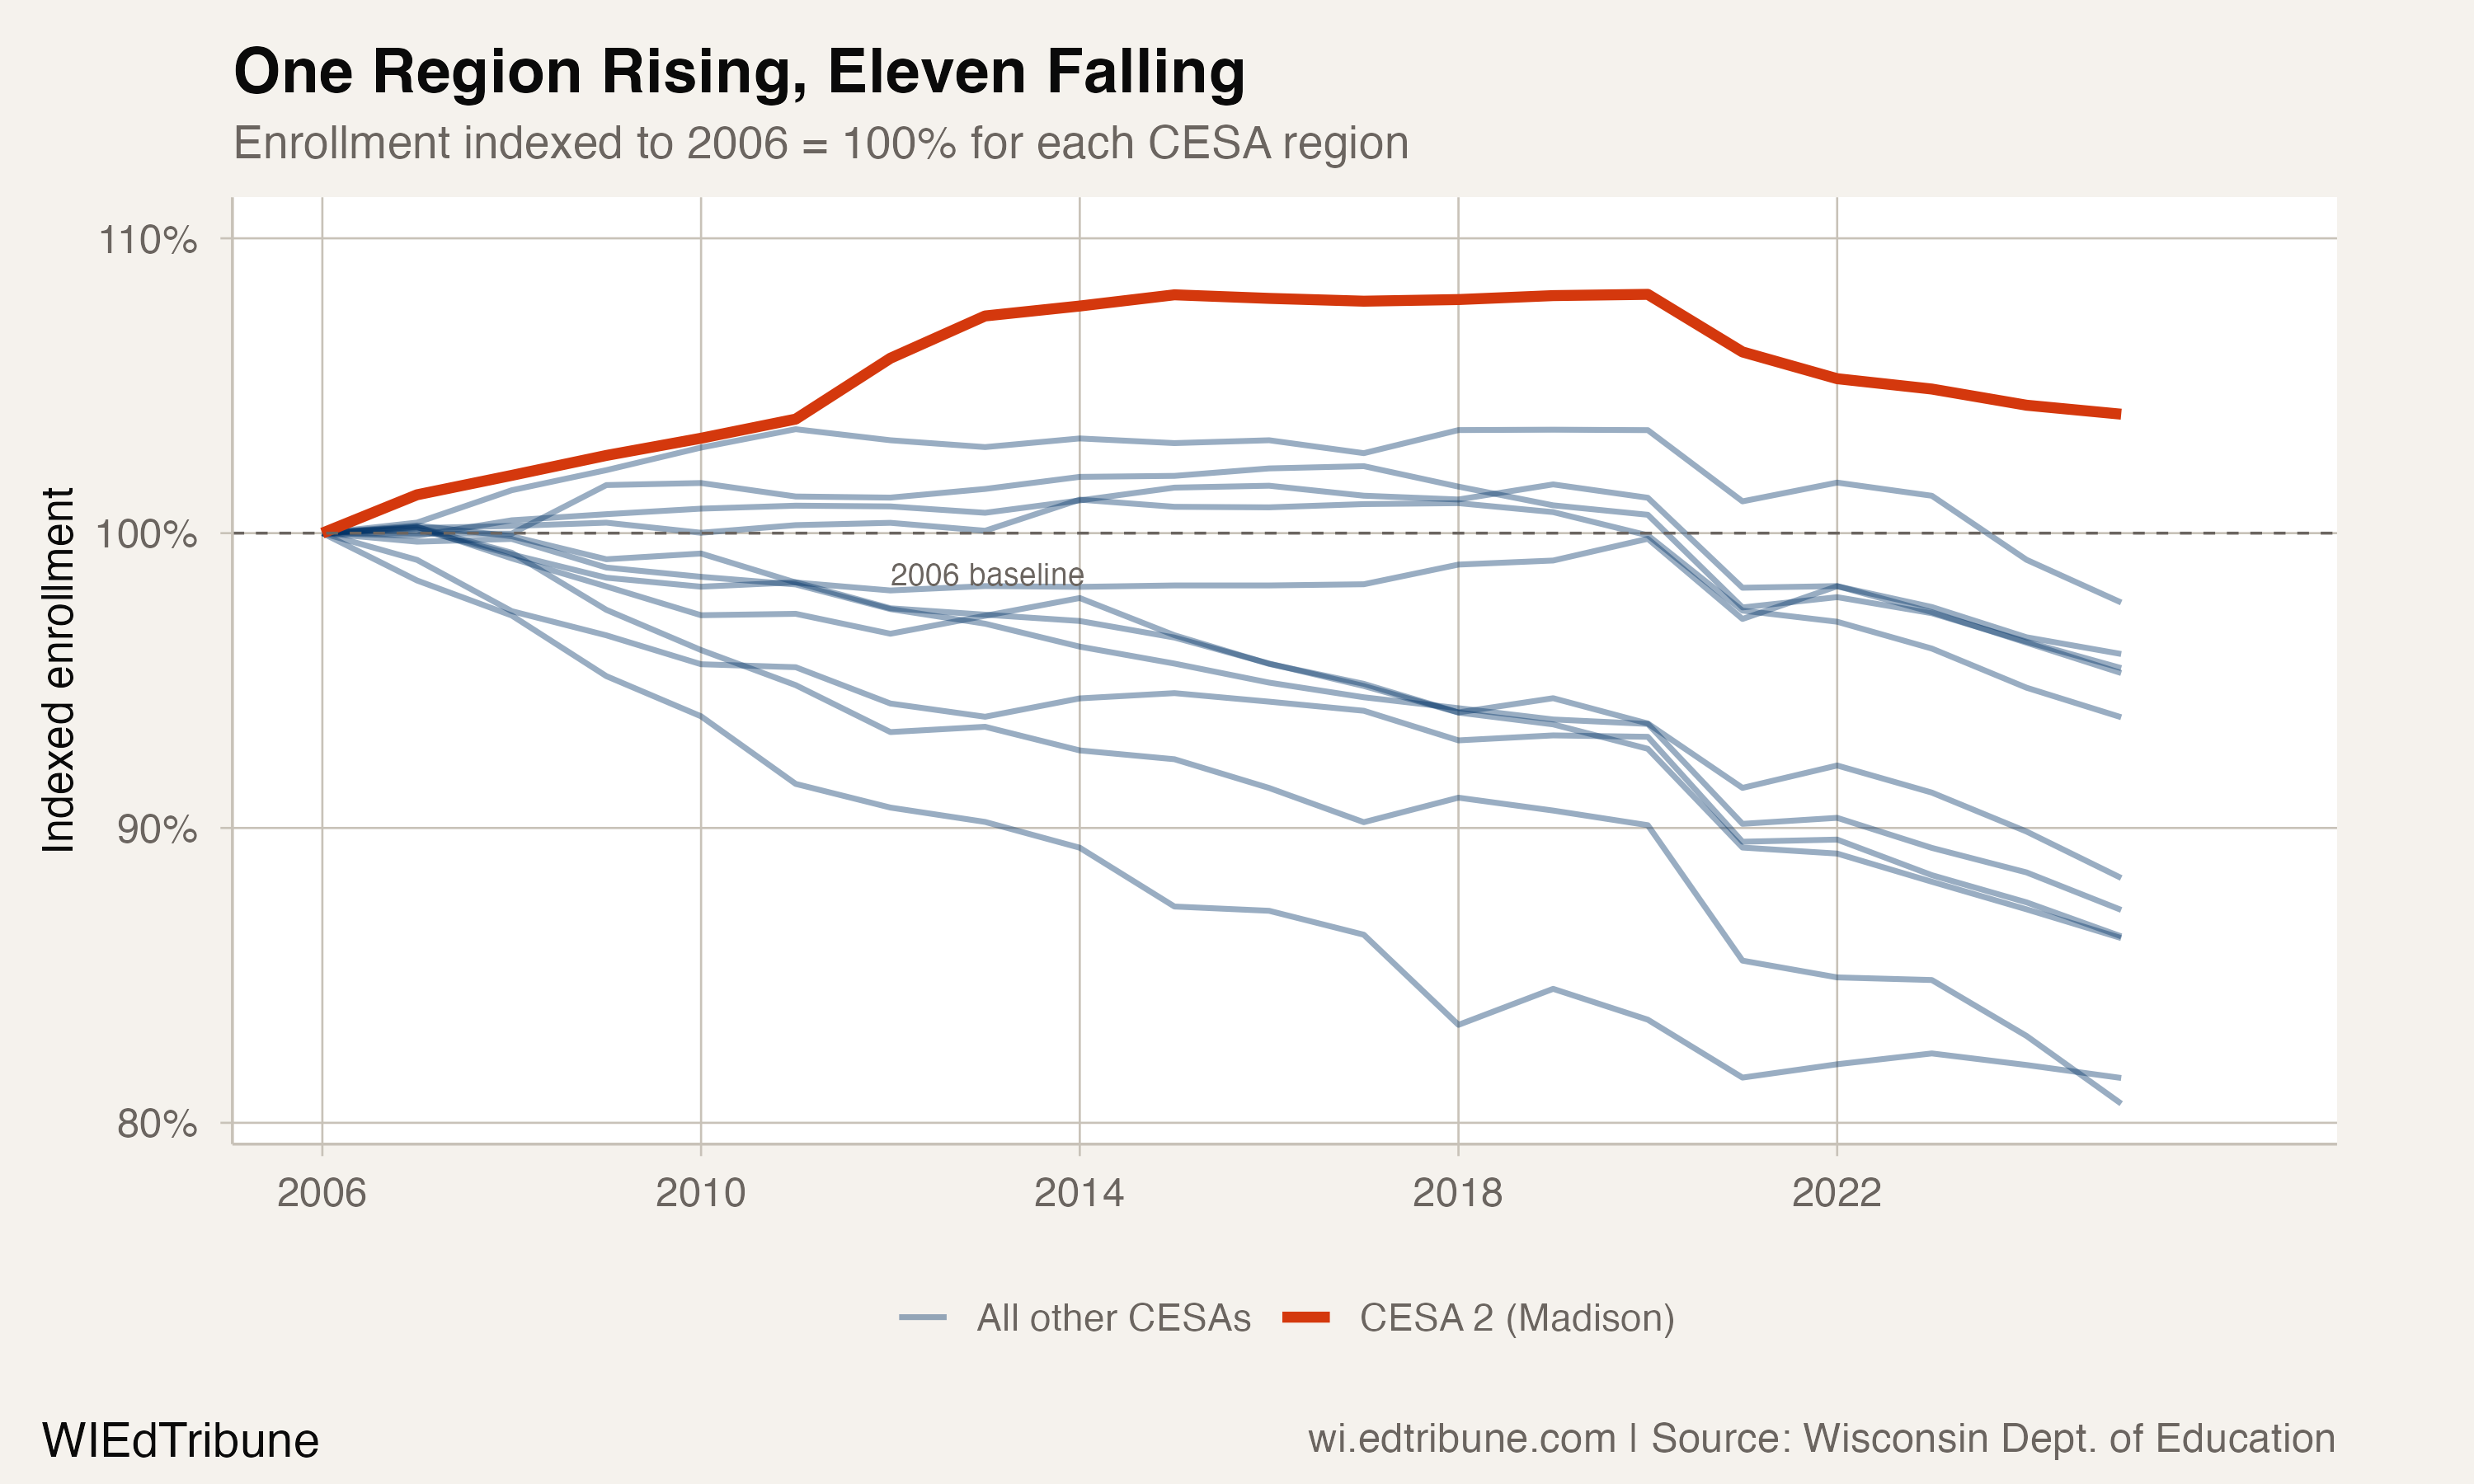
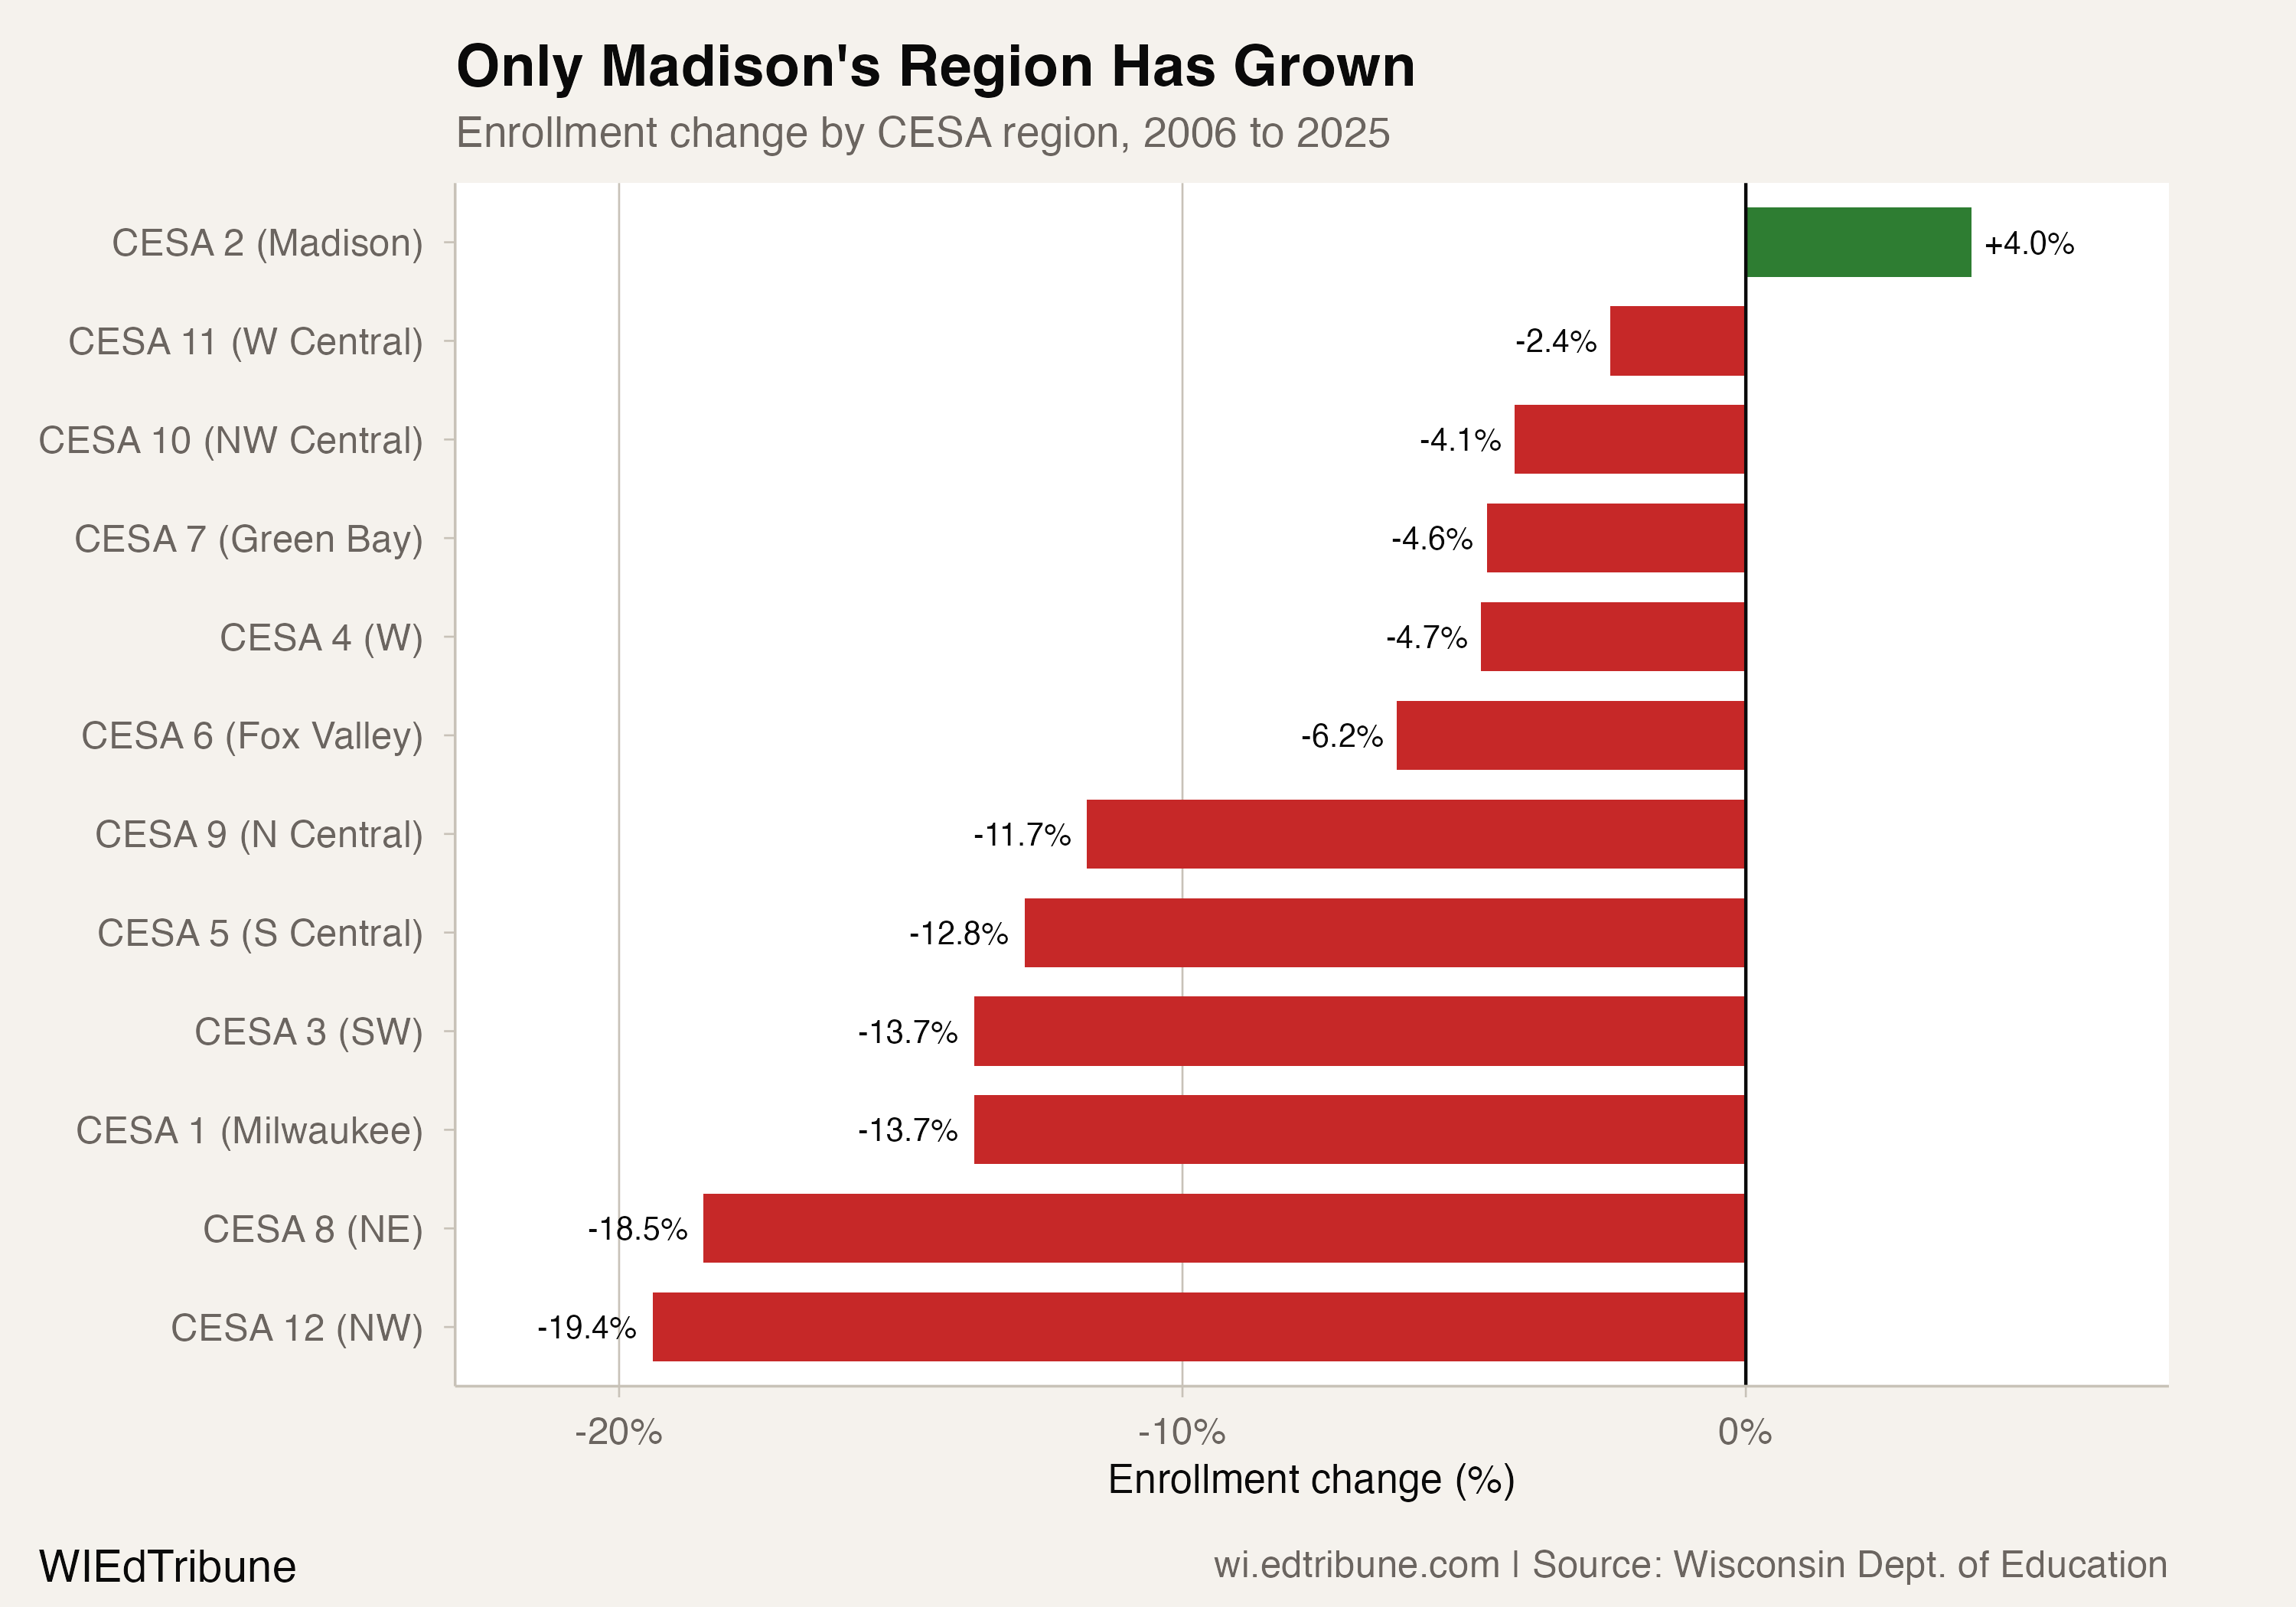
From 2006 to 2025, exactly one region gained students. CESA 2 added 5,793 students, a 4.0% increase. The other 11 regions lost a combined 73,433 students across the same period.
The shape of the divide
CESA 12 and CESA 8 recorded the largest percentage declines, losing 19.4% and 18.5% of their enrollment. CESA 1 lost 37,168 students, or 13.7%. That decline represented 54.9% of Wisconsin's statewide loss of 67,640 students.
CESA 2 sits alone above the zero line. Its share of statewide enrollment increased from 16.4% to 18.5%.
Two metros, opposite trajectories
The two largest CESA regions by 2025 enrollment followed different long-run paths.
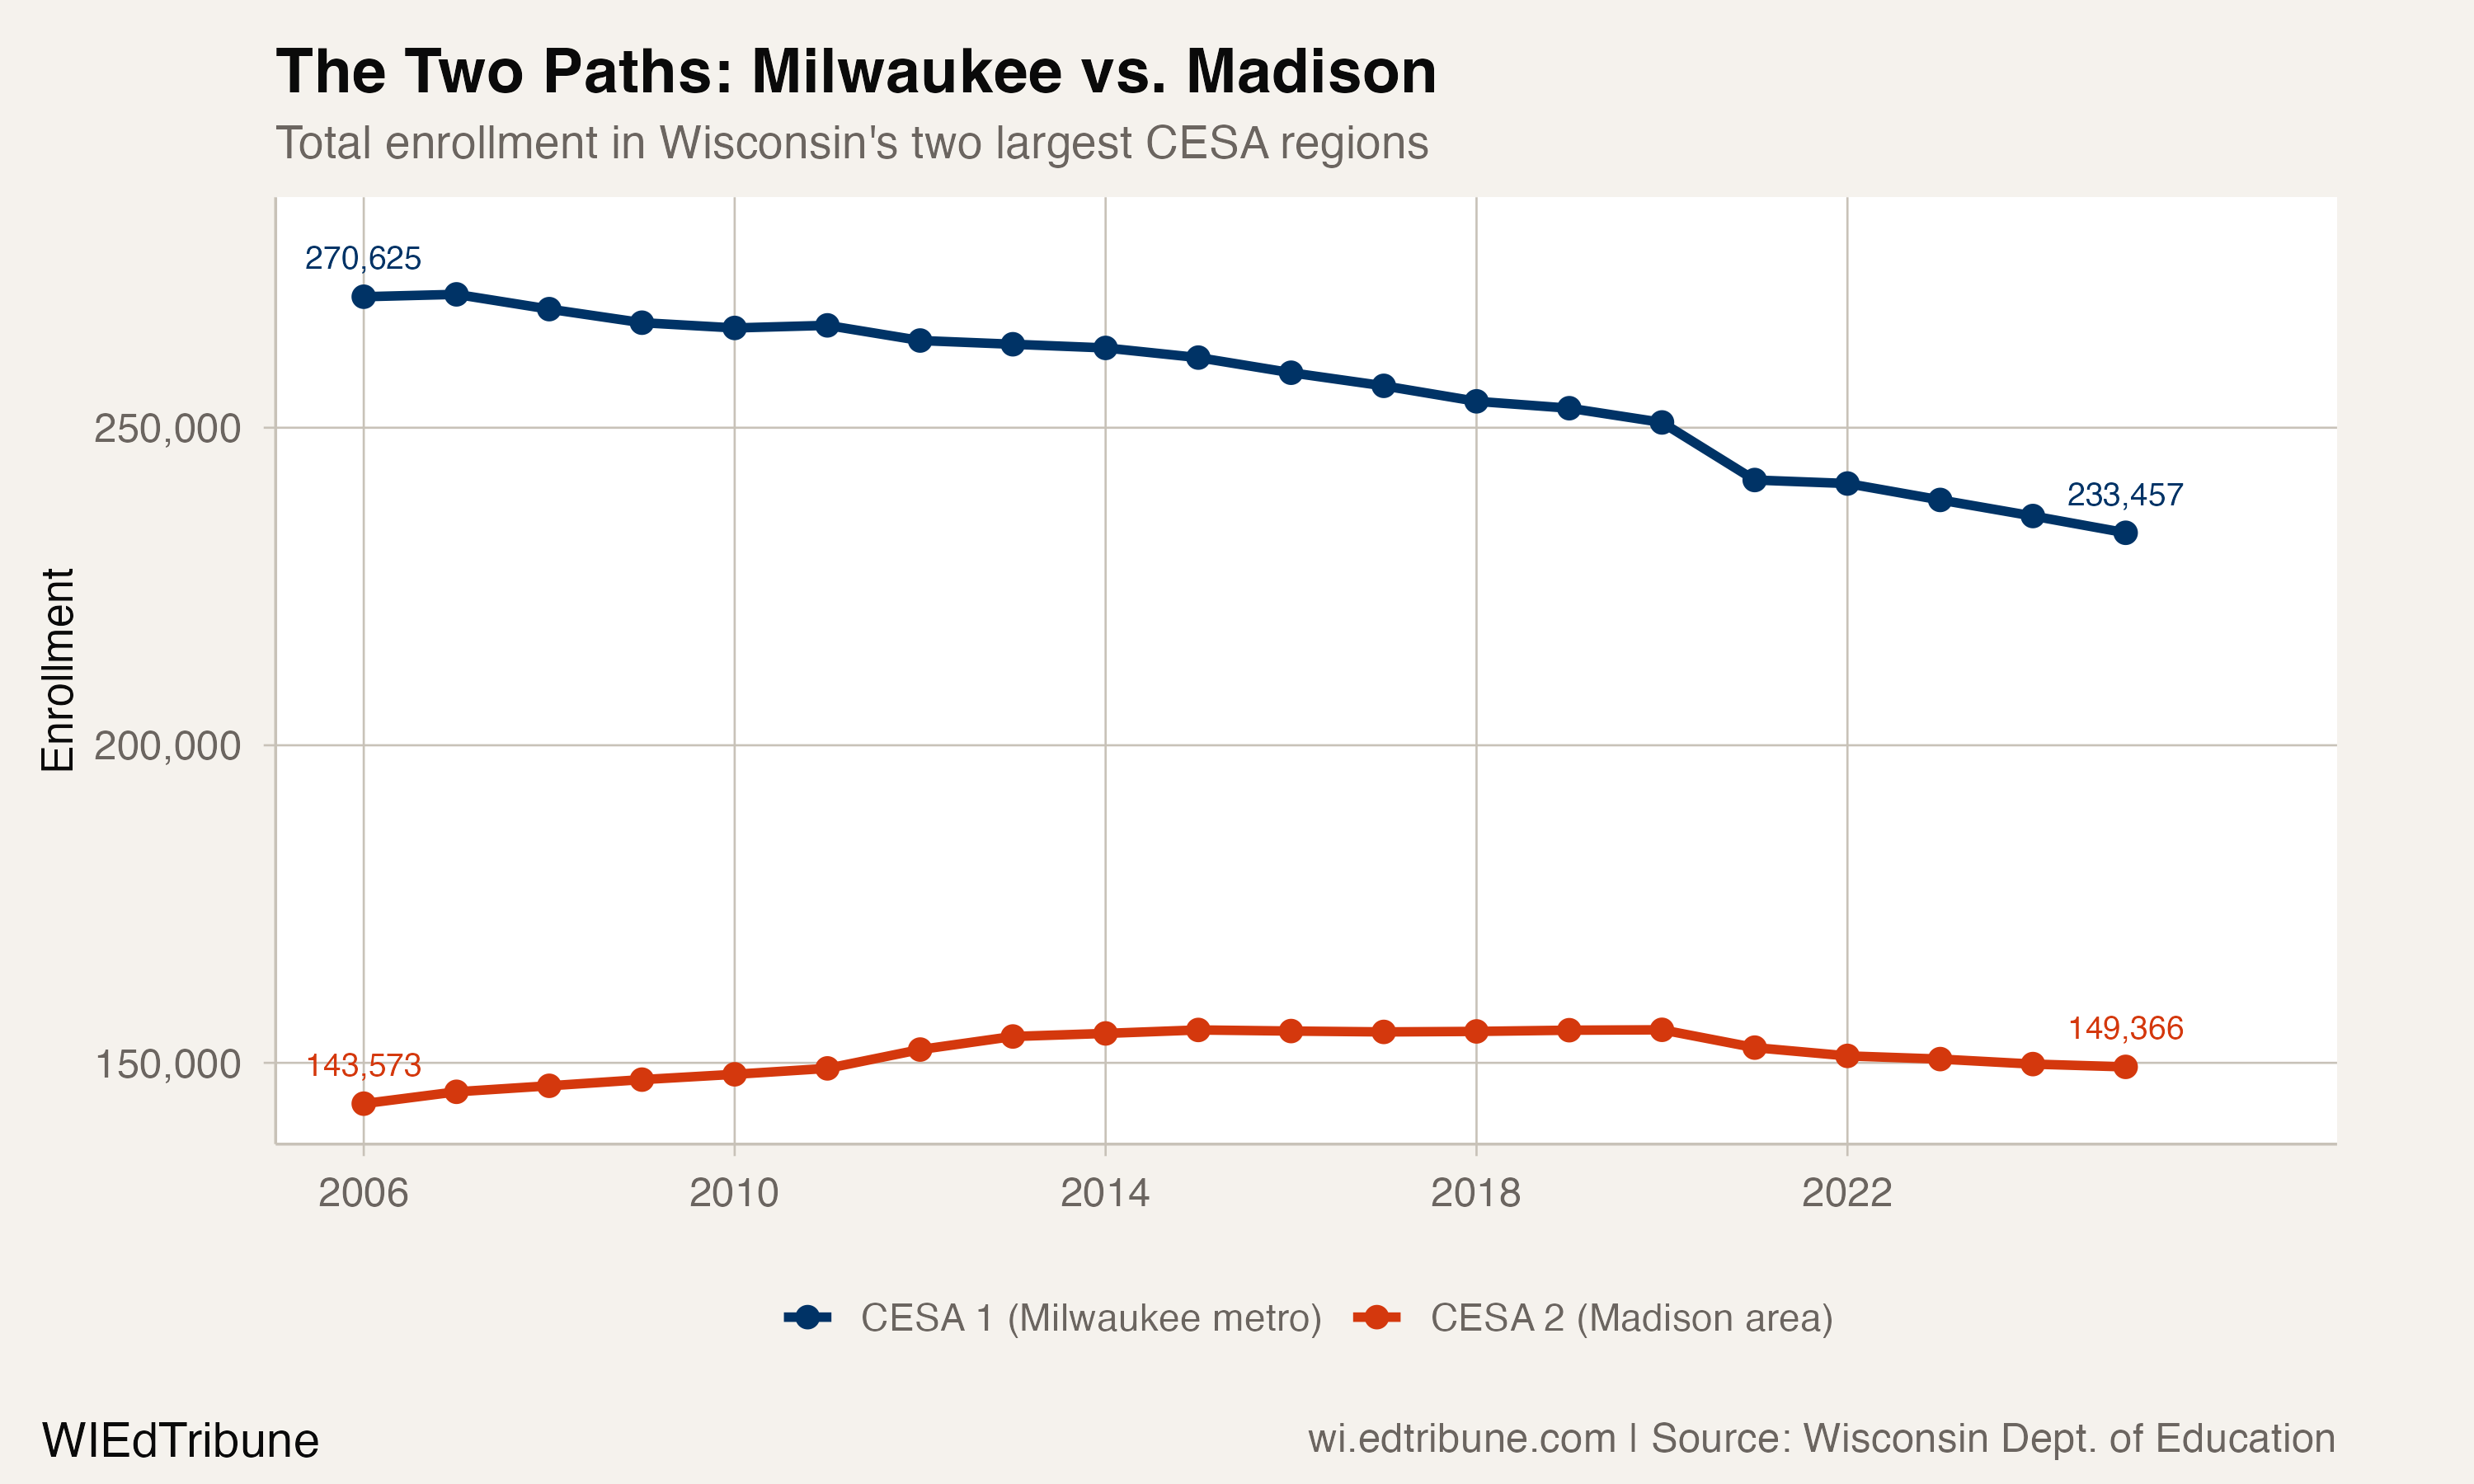
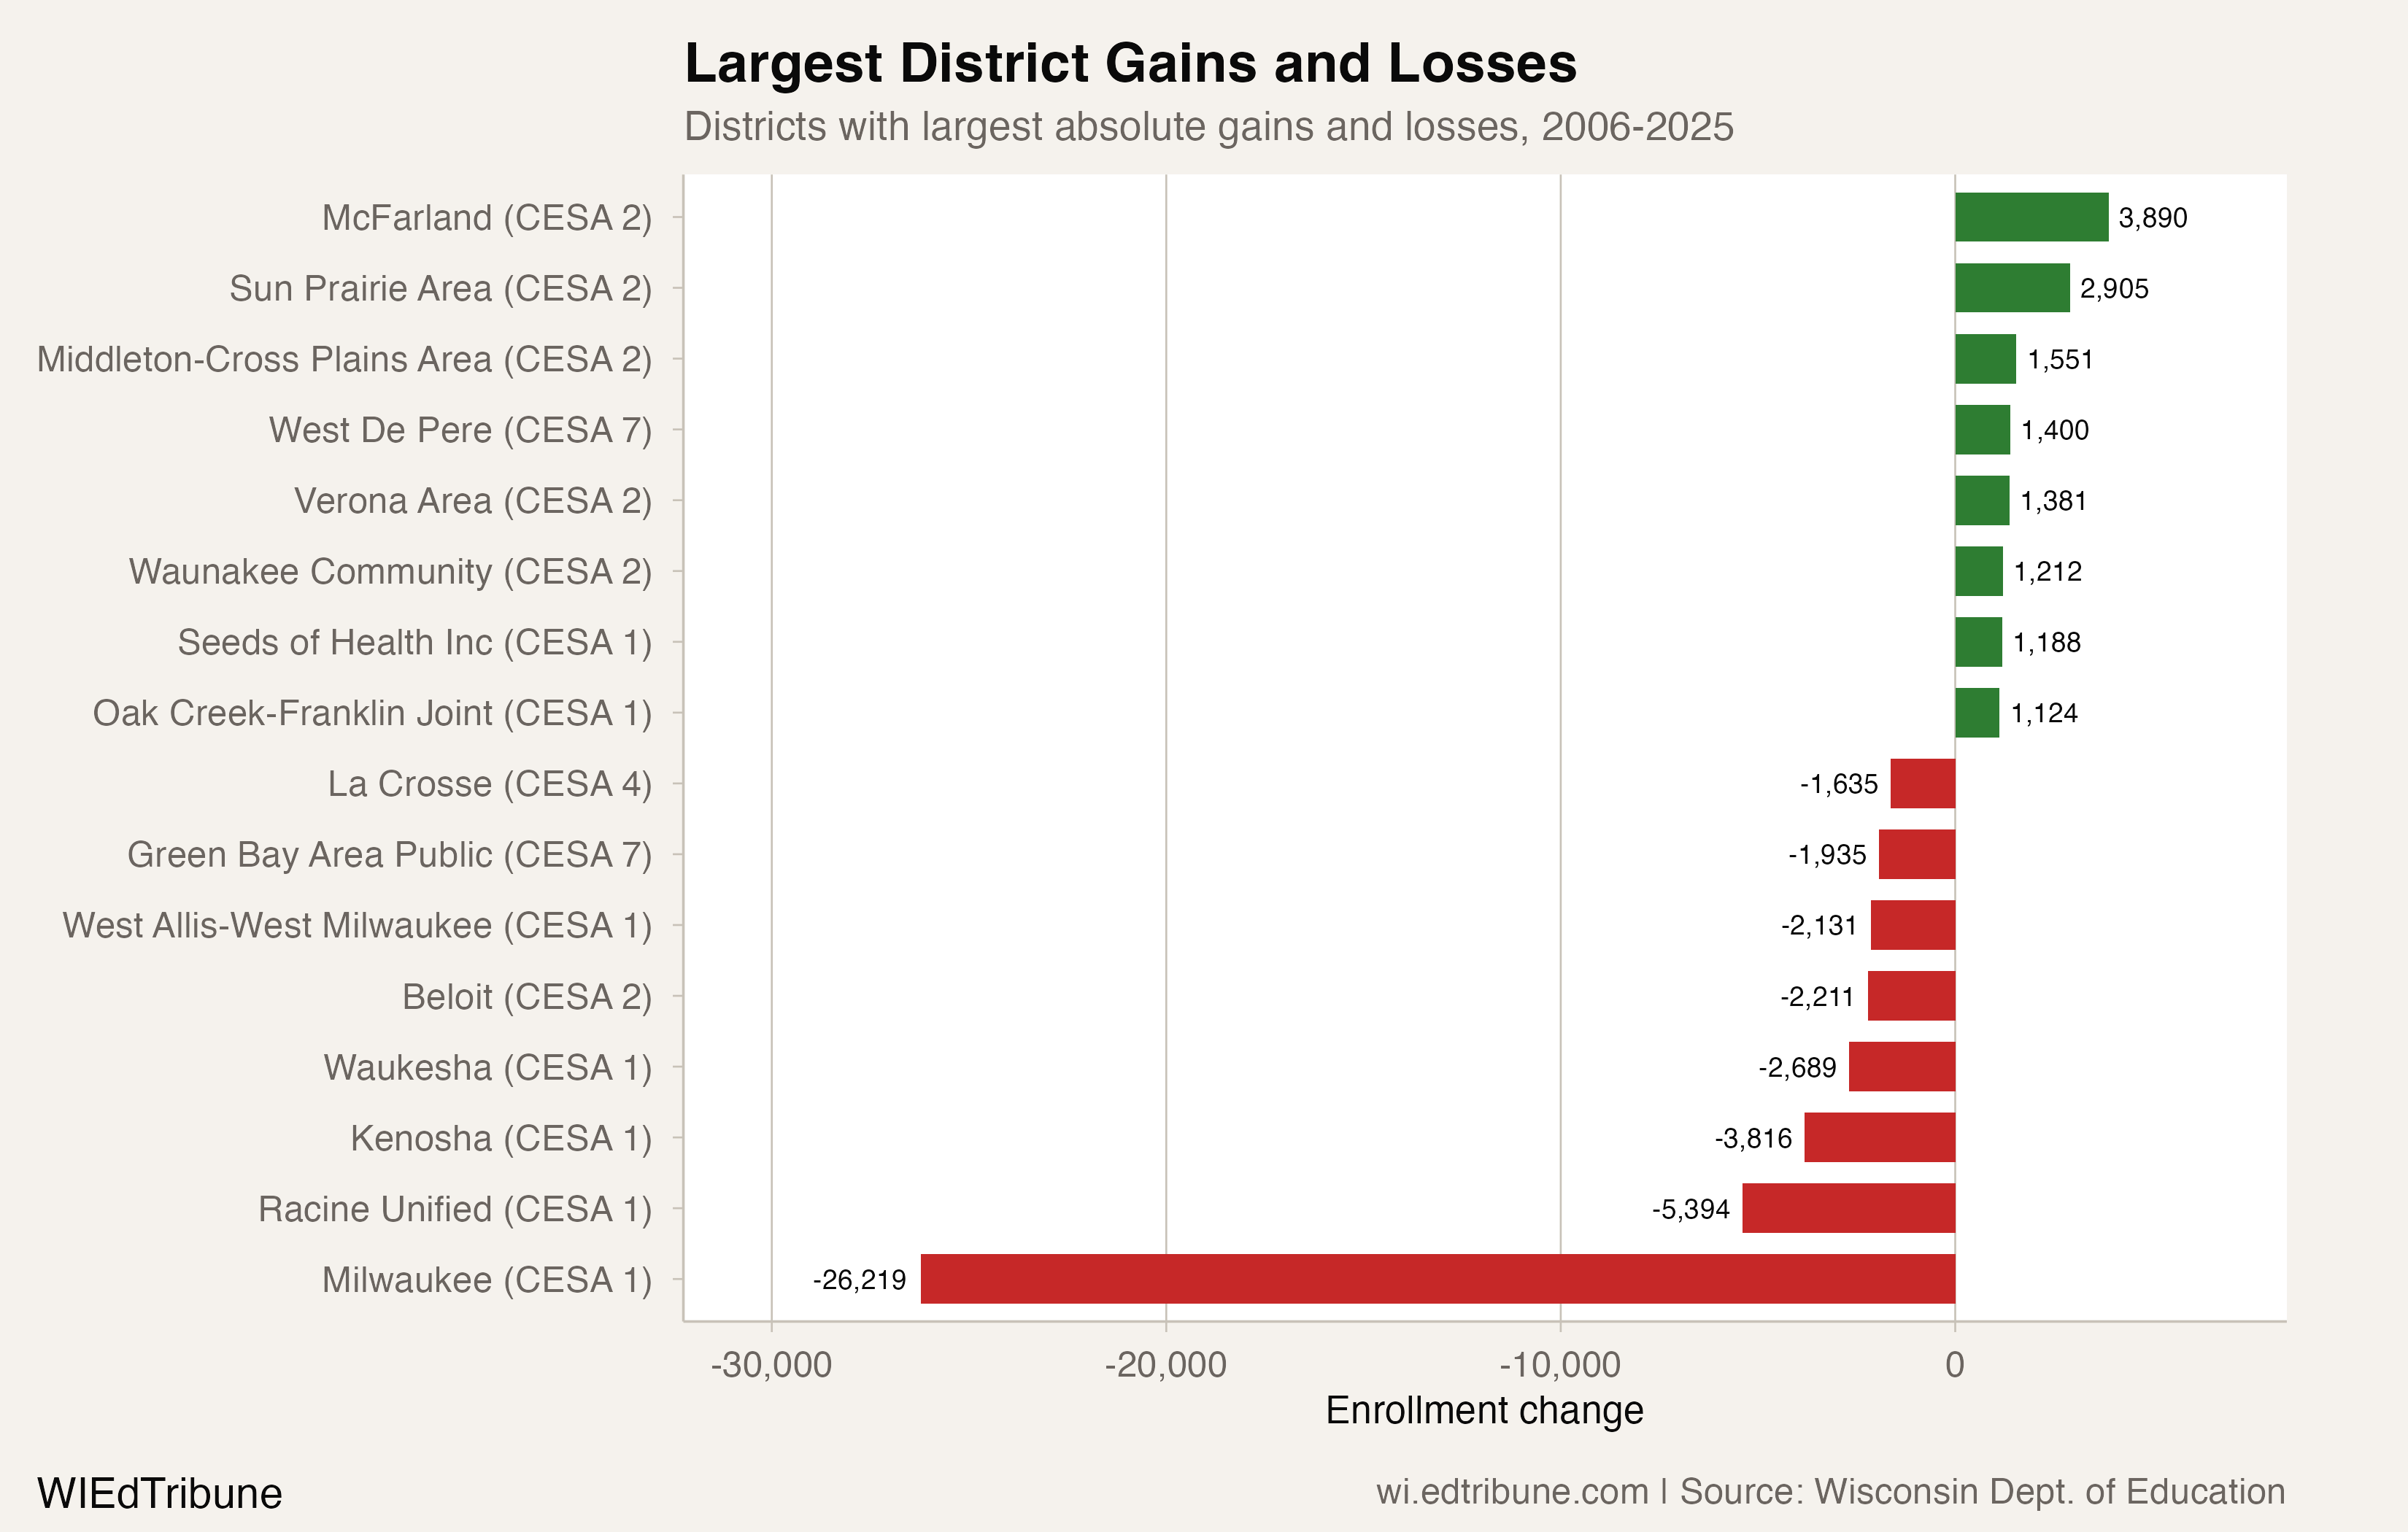
CESA 1, which includes Milwaukee↗ET, started 2006 with 270,625 students, compared with CESA 2's 143,573. By 2025, the totals were 233,457 and 149,366. Milwaukee alone lost 26,219 students, a 28.6% decline that accounted for 70.5% of CESA 1's loss.
The largest full-period gains among CESA 2 districts included Sun Prairie Area↗ET, up 2,905 students, or 51.0%; Verona Area, up 1,381, or 31.3%; Waunakee Community, up 1,212, or 37.8%; and De Forest Area, up 1,025, or 31.8%. Madison Metropolitan gained 703 students, or 2.9%.
McFarland↗ET had CESA 2's largest percentage gain among districts with records at both endpoints, rising 191.5%. Package directory records classify 3,584 of the district's 5,921 students as attending virtual schools, a 60.5% share. That reporting structure makes McFarland different from the region's brick-and-mortar district comparisons.
The long-run gain meets a recent decline
CESA 2 peaked at 155,201 students in 2020. It then declined in five consecutive annual transitions, losing 5,835 students through 2025.
Mitchell Lilly, CESA 2's executive director of communications, said in a written response that enrollment and budget pressures can look different from one community to the next. He pointed to the agency's partnership with the Wisconsin Association of School Business Officials on strategic planning for declining enrollment.
"Pairing enrollment data with housing, birth rates, migration, workforce trends, and other local factors would provide a fuller picture of what is shaping enrollment across the state." -- Mitchell Lilly, CESA 2
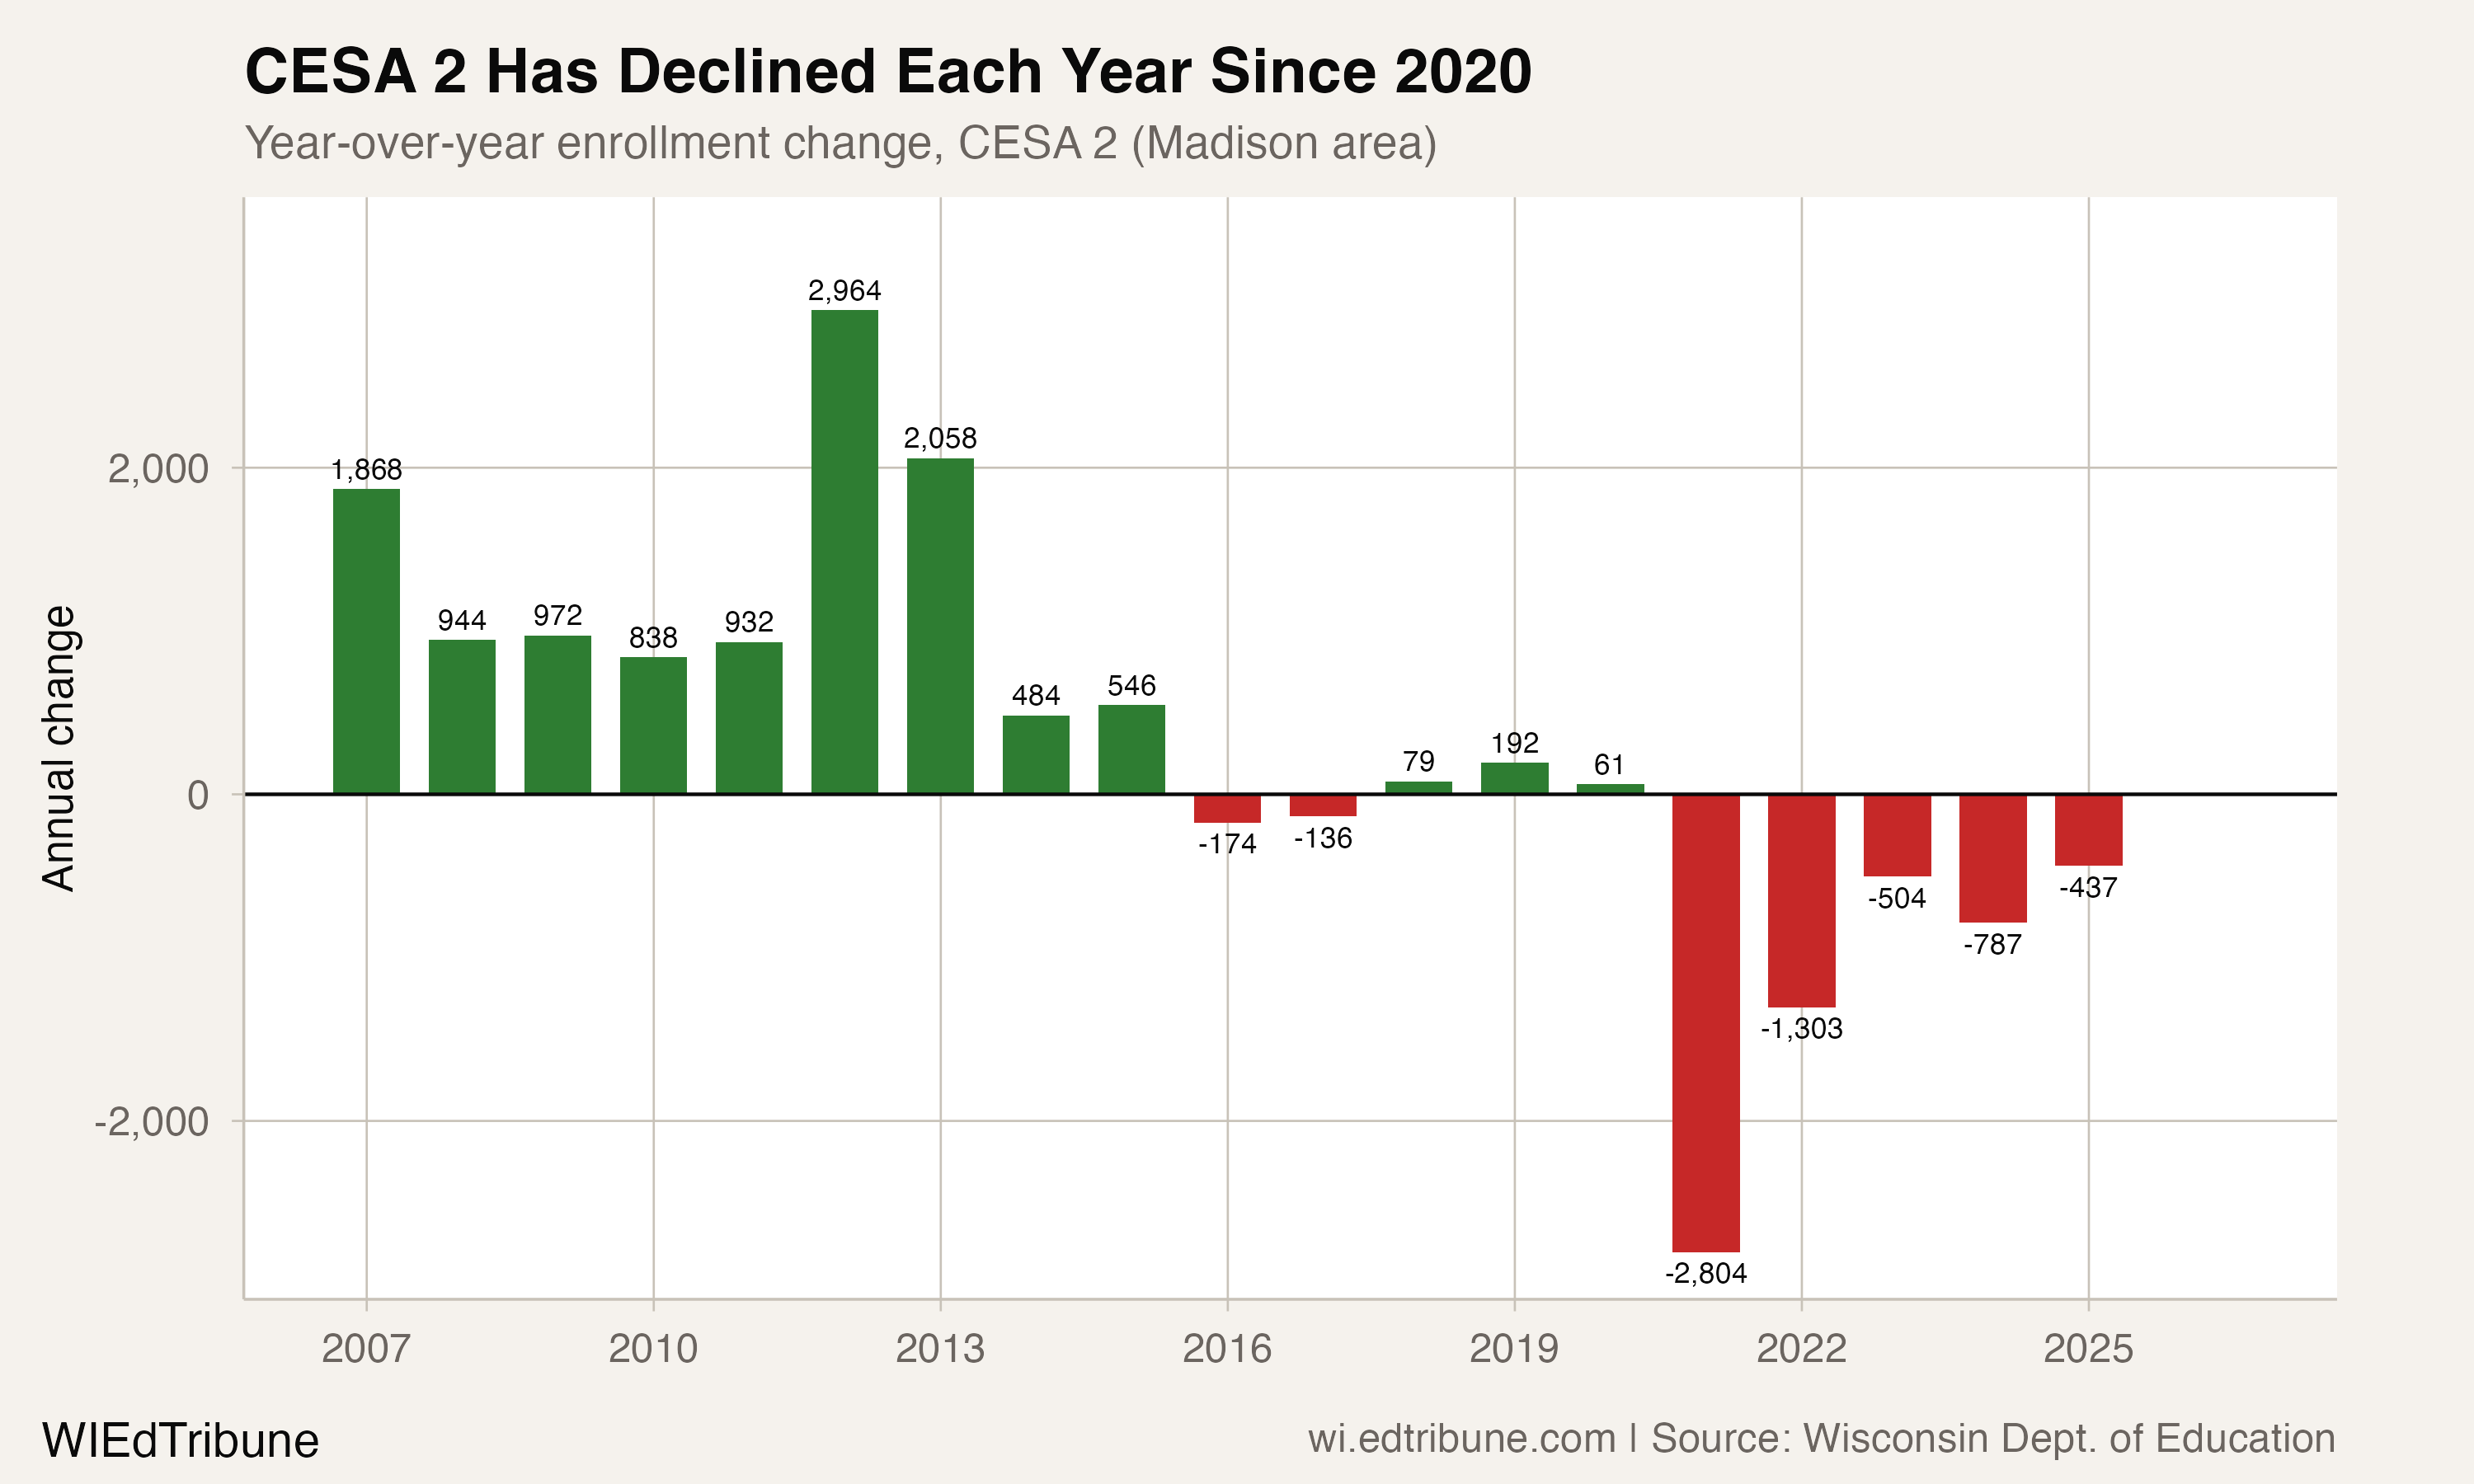
From 2007 to 2013, CESA 2 added between 838 and 2,964 students per year. Its gain slowed to 484 in 2014. The region declined in 2016 and 2017, posted small gains from 2018 through 2020, and then lost 2,804 students in 2021. That loss was larger than any annual gain since 2013. It lost another 1,303 students in 2022, 504 in 2023, 787 in 2024 and 437 in 2025.
Among the 73 current CESA 2 districts with enrollment records at both endpoints, 29 grew and 44 declined. Beloit lost 2,211 students, or 30.8%, while Janesville lost 1,234, or 11.7%. The regional total therefore combines large district gains and losses rather than describing a uniform local pattern.
What is emptying the edges
Every one of the 16 current CESA 12 districts with enrollment records at both endpoints lost students. Superior↗ET, the region's largest district in 2025, dropped from 4,768 to 3,900 students, or 18.2%. Mercer lost 50.8% of its enrollment, Winter lost 45.8% and Drummond Area lost 42.0%. Among all 17 current CESA 12 districts, 11 were at their lowest level in the available 2006-2025 panel. The region's 64.7% share was the highest among the 12 CESAs.
A planning question for every region
From 2020 to 2025, enrollment declined in all 12 CESAs. CESA 2 still finished 2025 above its 2006 enrollment, but its five-year run of annual declines changed the question from whether the region had grown to how its districts plan around sharply different local paths. Lilly's written response puts that distinction at the center: statewide and regional totals are a starting point, while each community's planning depends on its own conditions.
Enrollment and district-directory records come from the Wisconsin Department of Public Instruction.
The analysis covers reporting years 2006 through 2025.
Detailed code that reproduces the analysis and figures in this article is available exclusively to EdTribune subscribers.
Discussion
Sign in to join the discussion.
Loading comments...