Correction (July 21, 2026): The original analysis omitted an available package year and then understated the number of annual transitions. It also treated a same-year kindergarten-to-grade-12 comparison as a guaranteed enrollment forecast and attributed the pattern to causes the enrollment data do not establish. This version uses fresh Wisconsin DPI enrollment data for every year and limits its conclusions to the observed enrollment panel.
Wisconsin reported 50,990 kindergarten students and 67,049 grade-12 students in 2025. Kindergarten was 16,059 students smaller, a ratio of 76.0 kindergarten students per 100 grade-12 students. Expressed another way, the kindergarten count was 24.0% smaller.
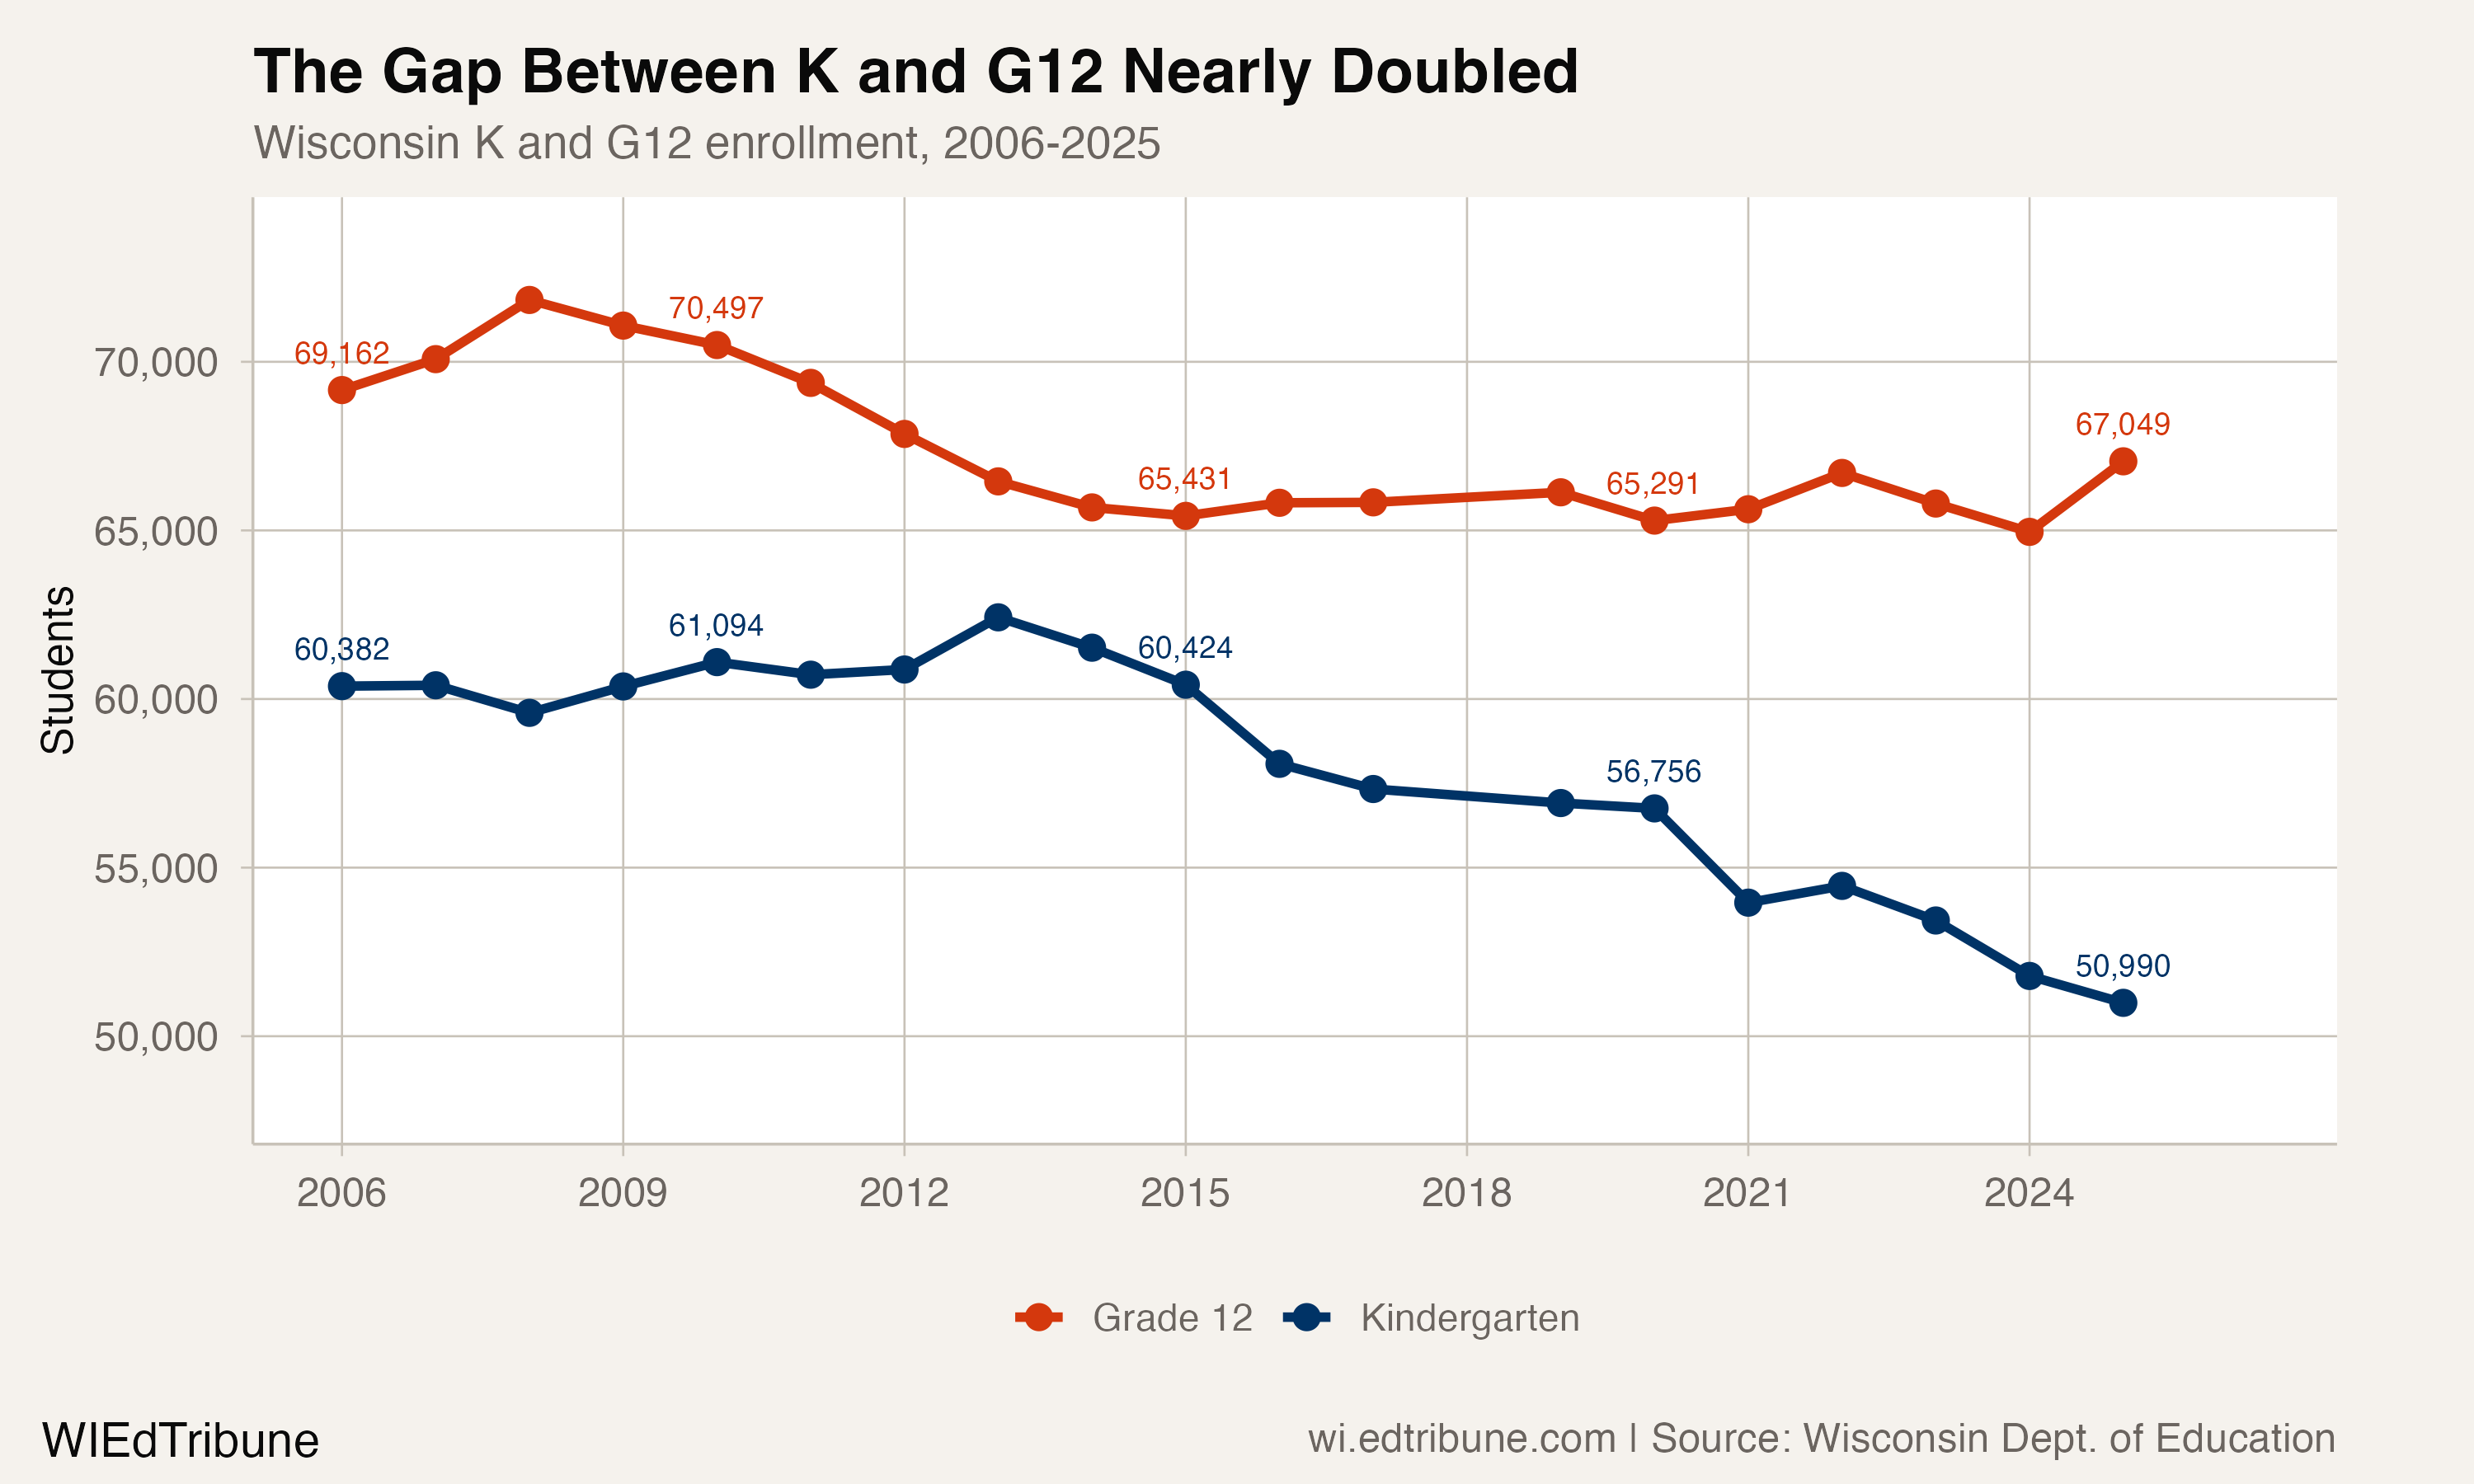
The ratio was the lowest in the 20-year package panel from 2006 through 2025. The comparison describes the two grades reported in each year. By itself, it does not project how many students will remain in public school or join the system before the kindergarten cohort reaches grade 12.
A Wider Cross-Sectional Gap
In 2006, Wisconsin reported 60,382 kindergarten students and 69,162 grade-12 students. The 8,780-student difference grew to 16,059 by 2025, an increase of 82.9%. The corresponding ratio moved from 87.3 to 76.0.
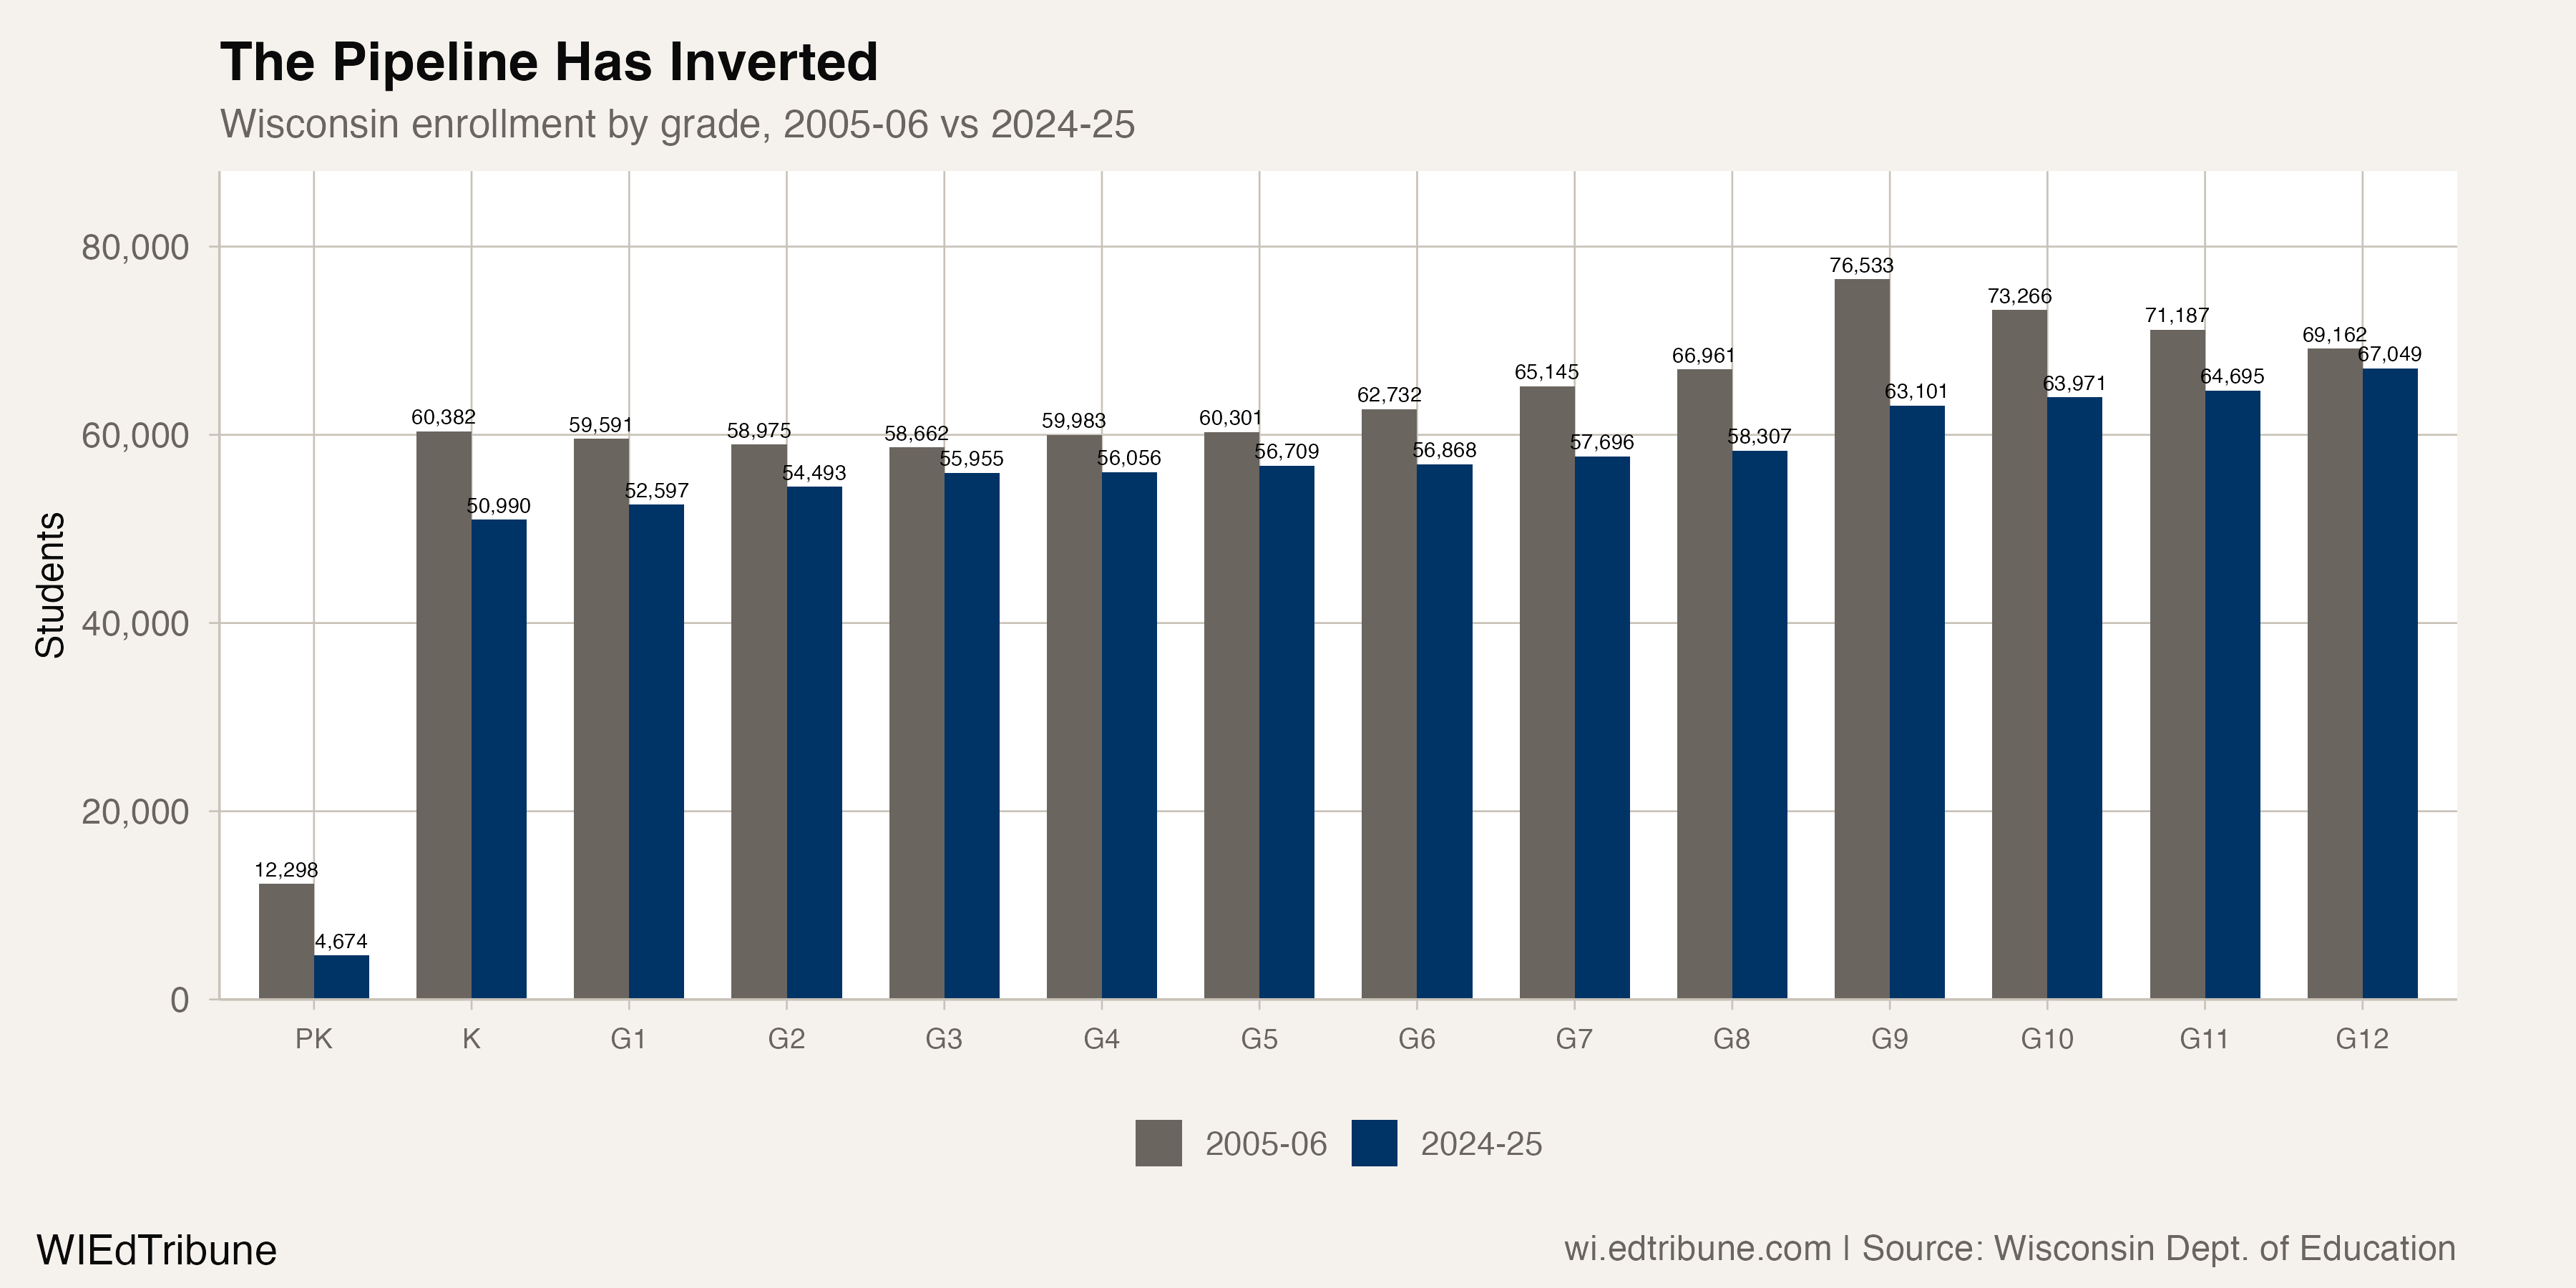
All 14 displayed grade categories were smaller in 2025 than in 2006. Pre-K fell from 12,298 to 4,674, a 62.0% decrease. Kindergarten fell 15.6%, first grade fell 11.7%, and grade 12 fell 3.1%.
In the 2025 cross-section, grades 1 through 5 ranged from 52,597 to 56,709 students. Grades 9 through 12 ranged from 63,101 to 67,049 students. Those ranges describe the current grade profile; they do not identify why the counts differ.
The Ratio Over Time
The ratio reached its panel high of 93.9 in 2013 and its panel low of 76.0 in 2025. From 2020 to 2025, it declined from 86.9 to 76.0, a 10.9-point change across 5 annual intervals.
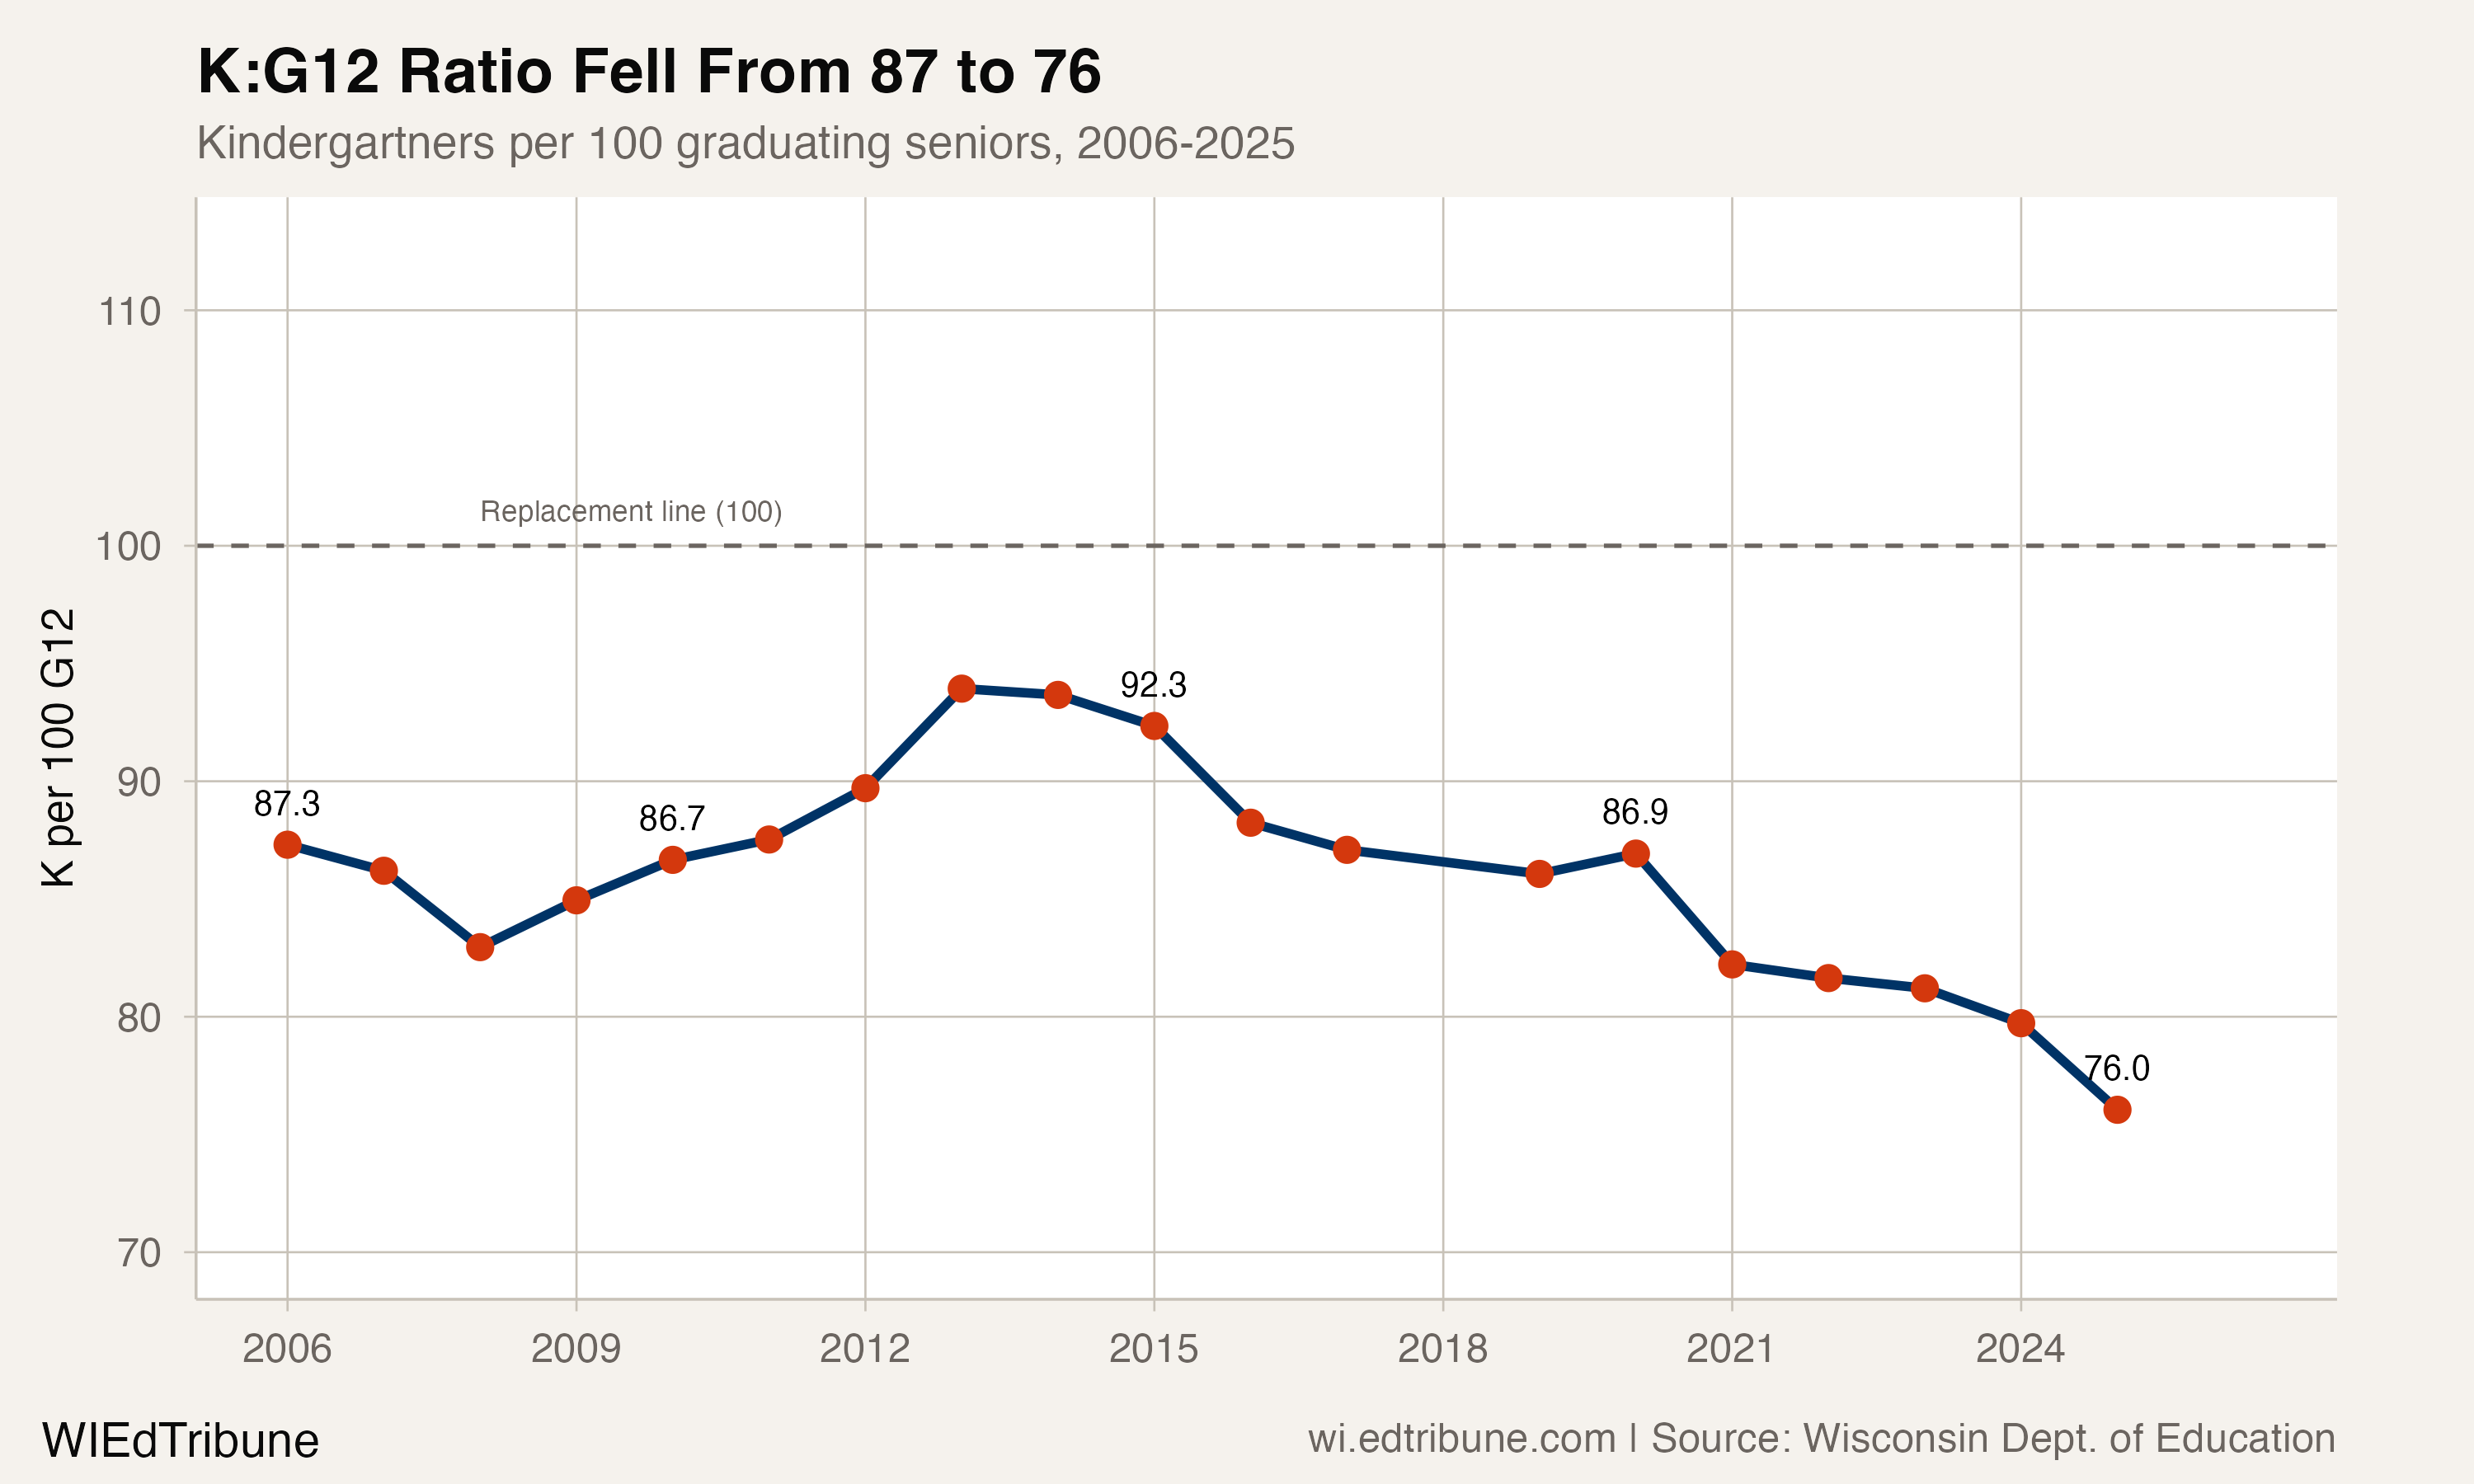
The ratio was below 100 throughout the panel. That means each year's kindergarten count was smaller than that same year's grade-12 count. It does not mean the kindergarten students are a closed cohort or that their future grade-12 count is already fixed.
Different Changes by Grade
Indexed to 100 in 2006, pre-K stood at 38 in 2025, kindergarten at 84, and grade 12 at 97. These are direct endpoint comparisons, not estimates of future enrollment.
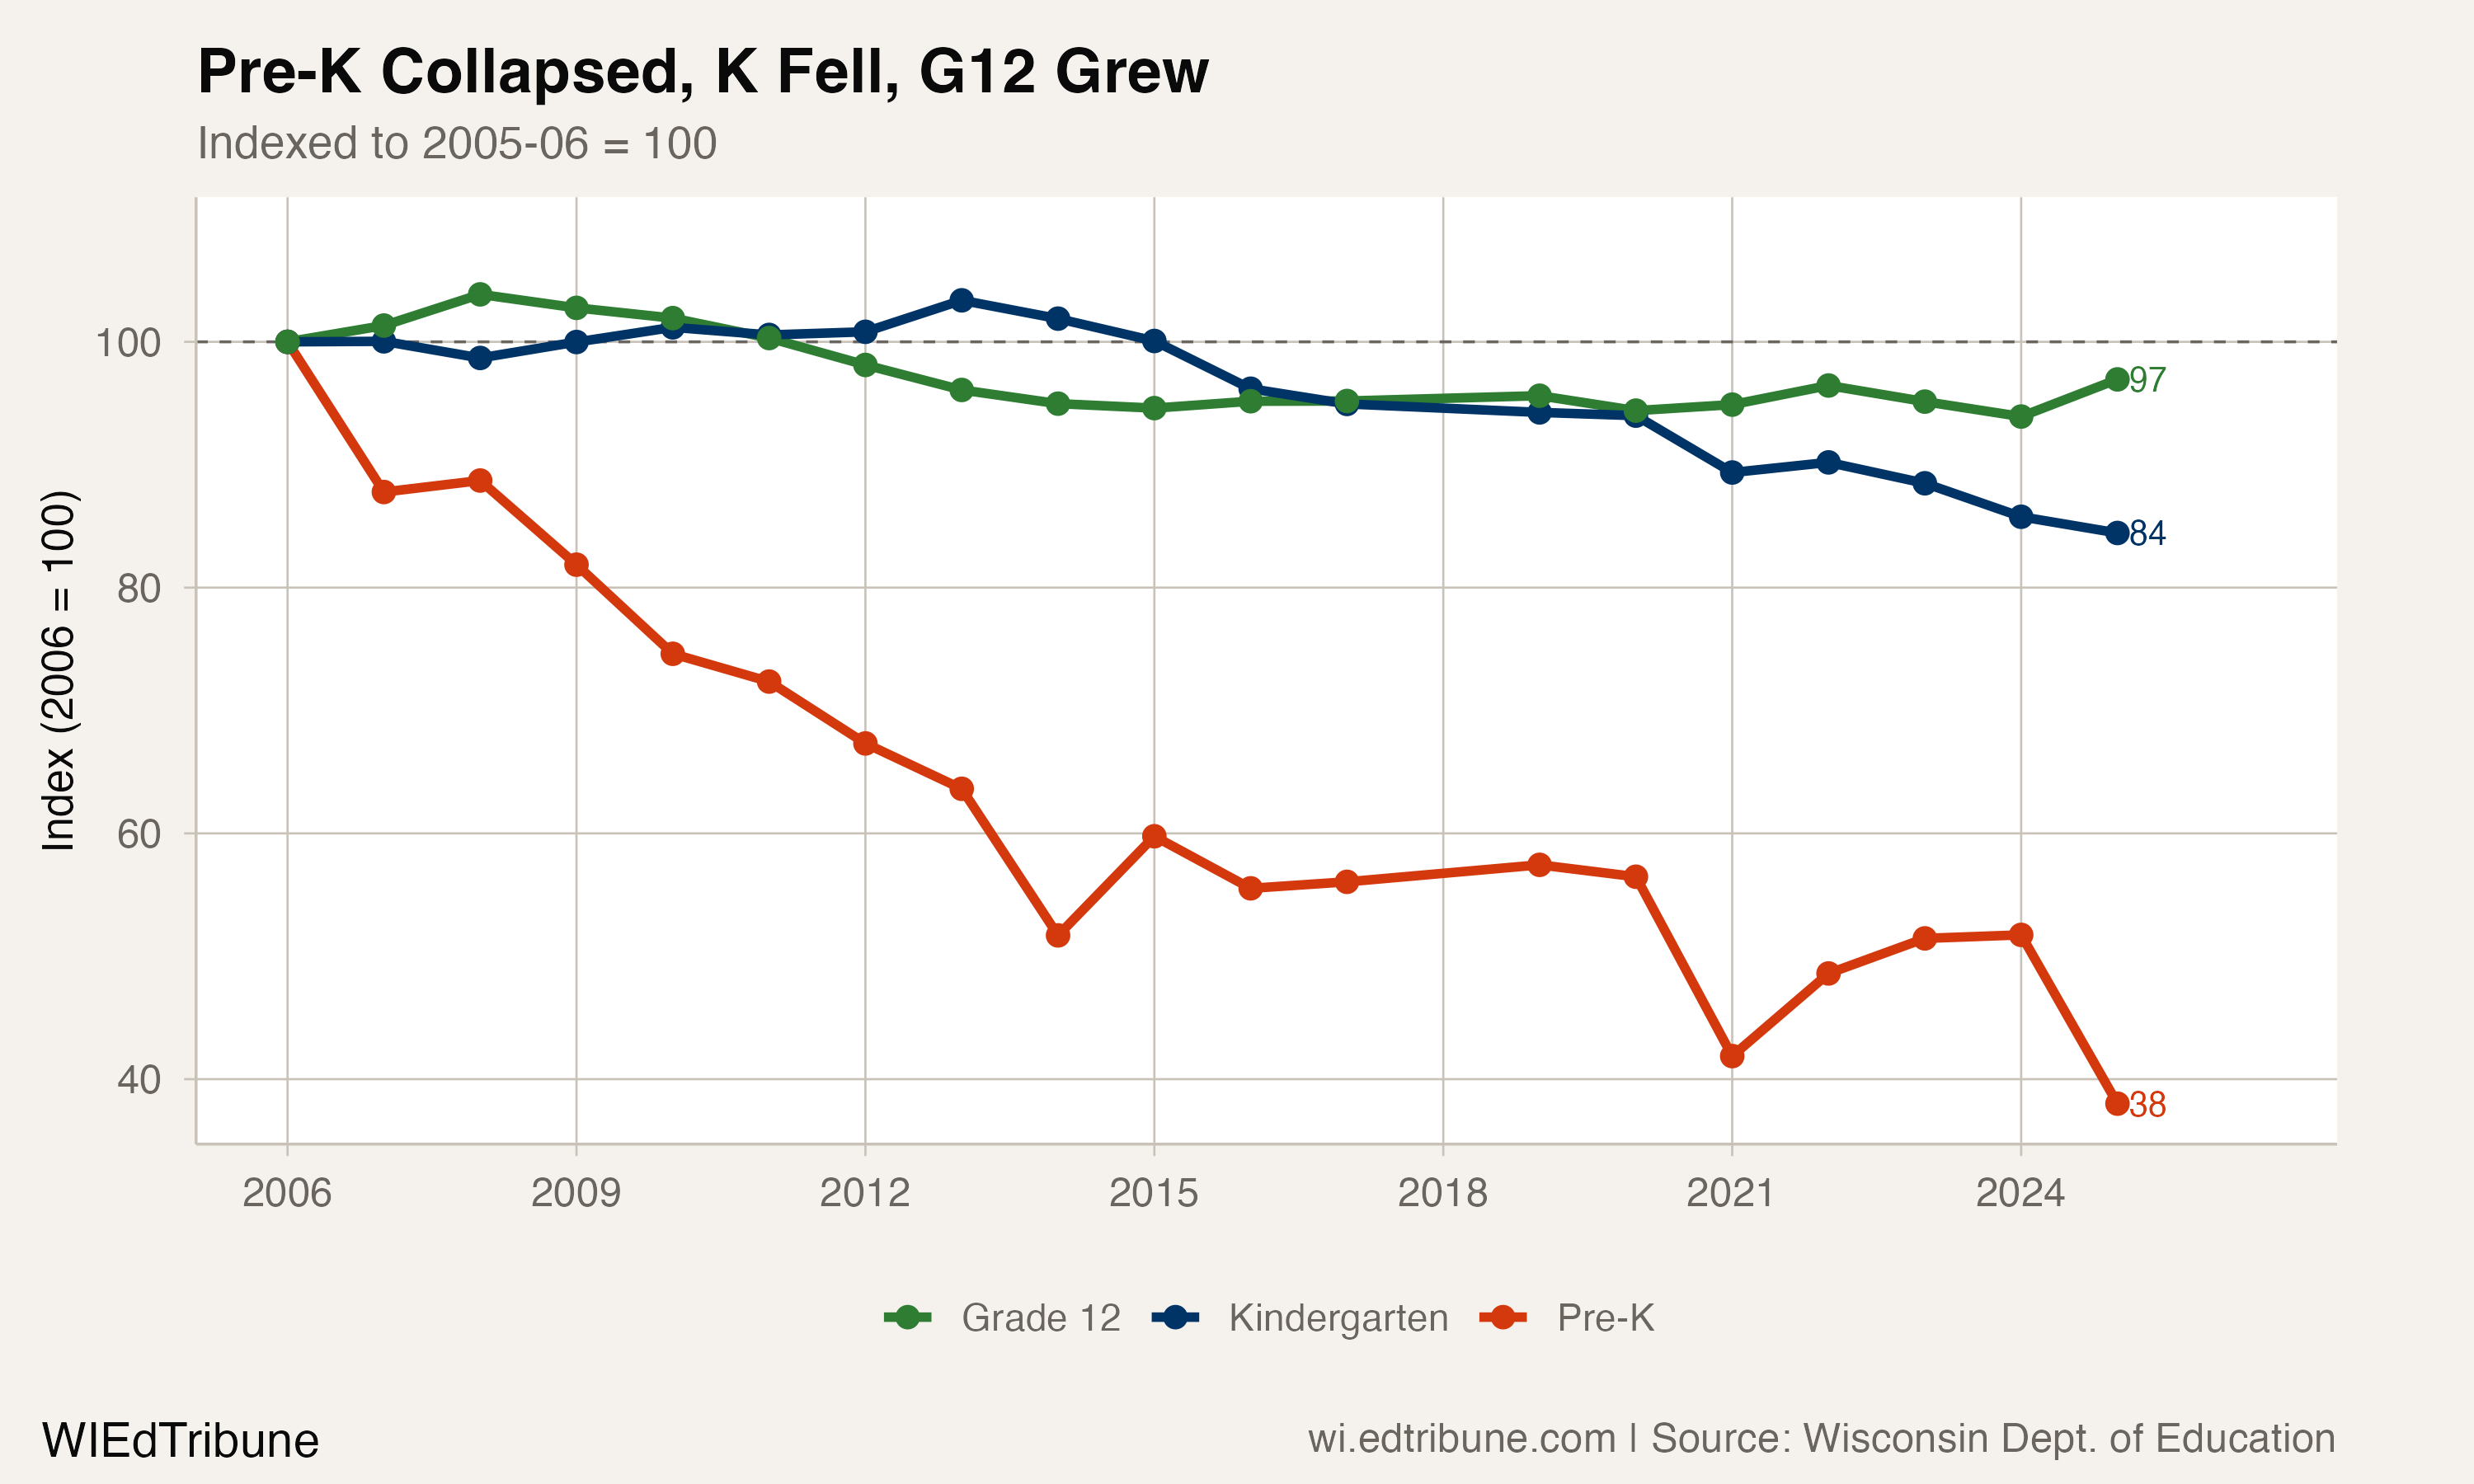
Across the full endpoints, elementary enrollment in kindergarten through grade 5 decreased by 31,094 students, or 8.7%. Enrollment in grades 9 through 12 decreased by 31,332 students, or 10.8%.
Kindergarten Transitions
Kindergarten enrollment decreased in 12 of 19 annual transitions. It reached a panel high of 62,422 in 2013, then decreased in 10 of the next 12 transitions.
The largest annual decrease was 2,795 students in 2021. Enrollment then increased by 497 in 2022 before decreasing by 1,026 in 2023, 1,645 in 2024, and 797 in 2025.
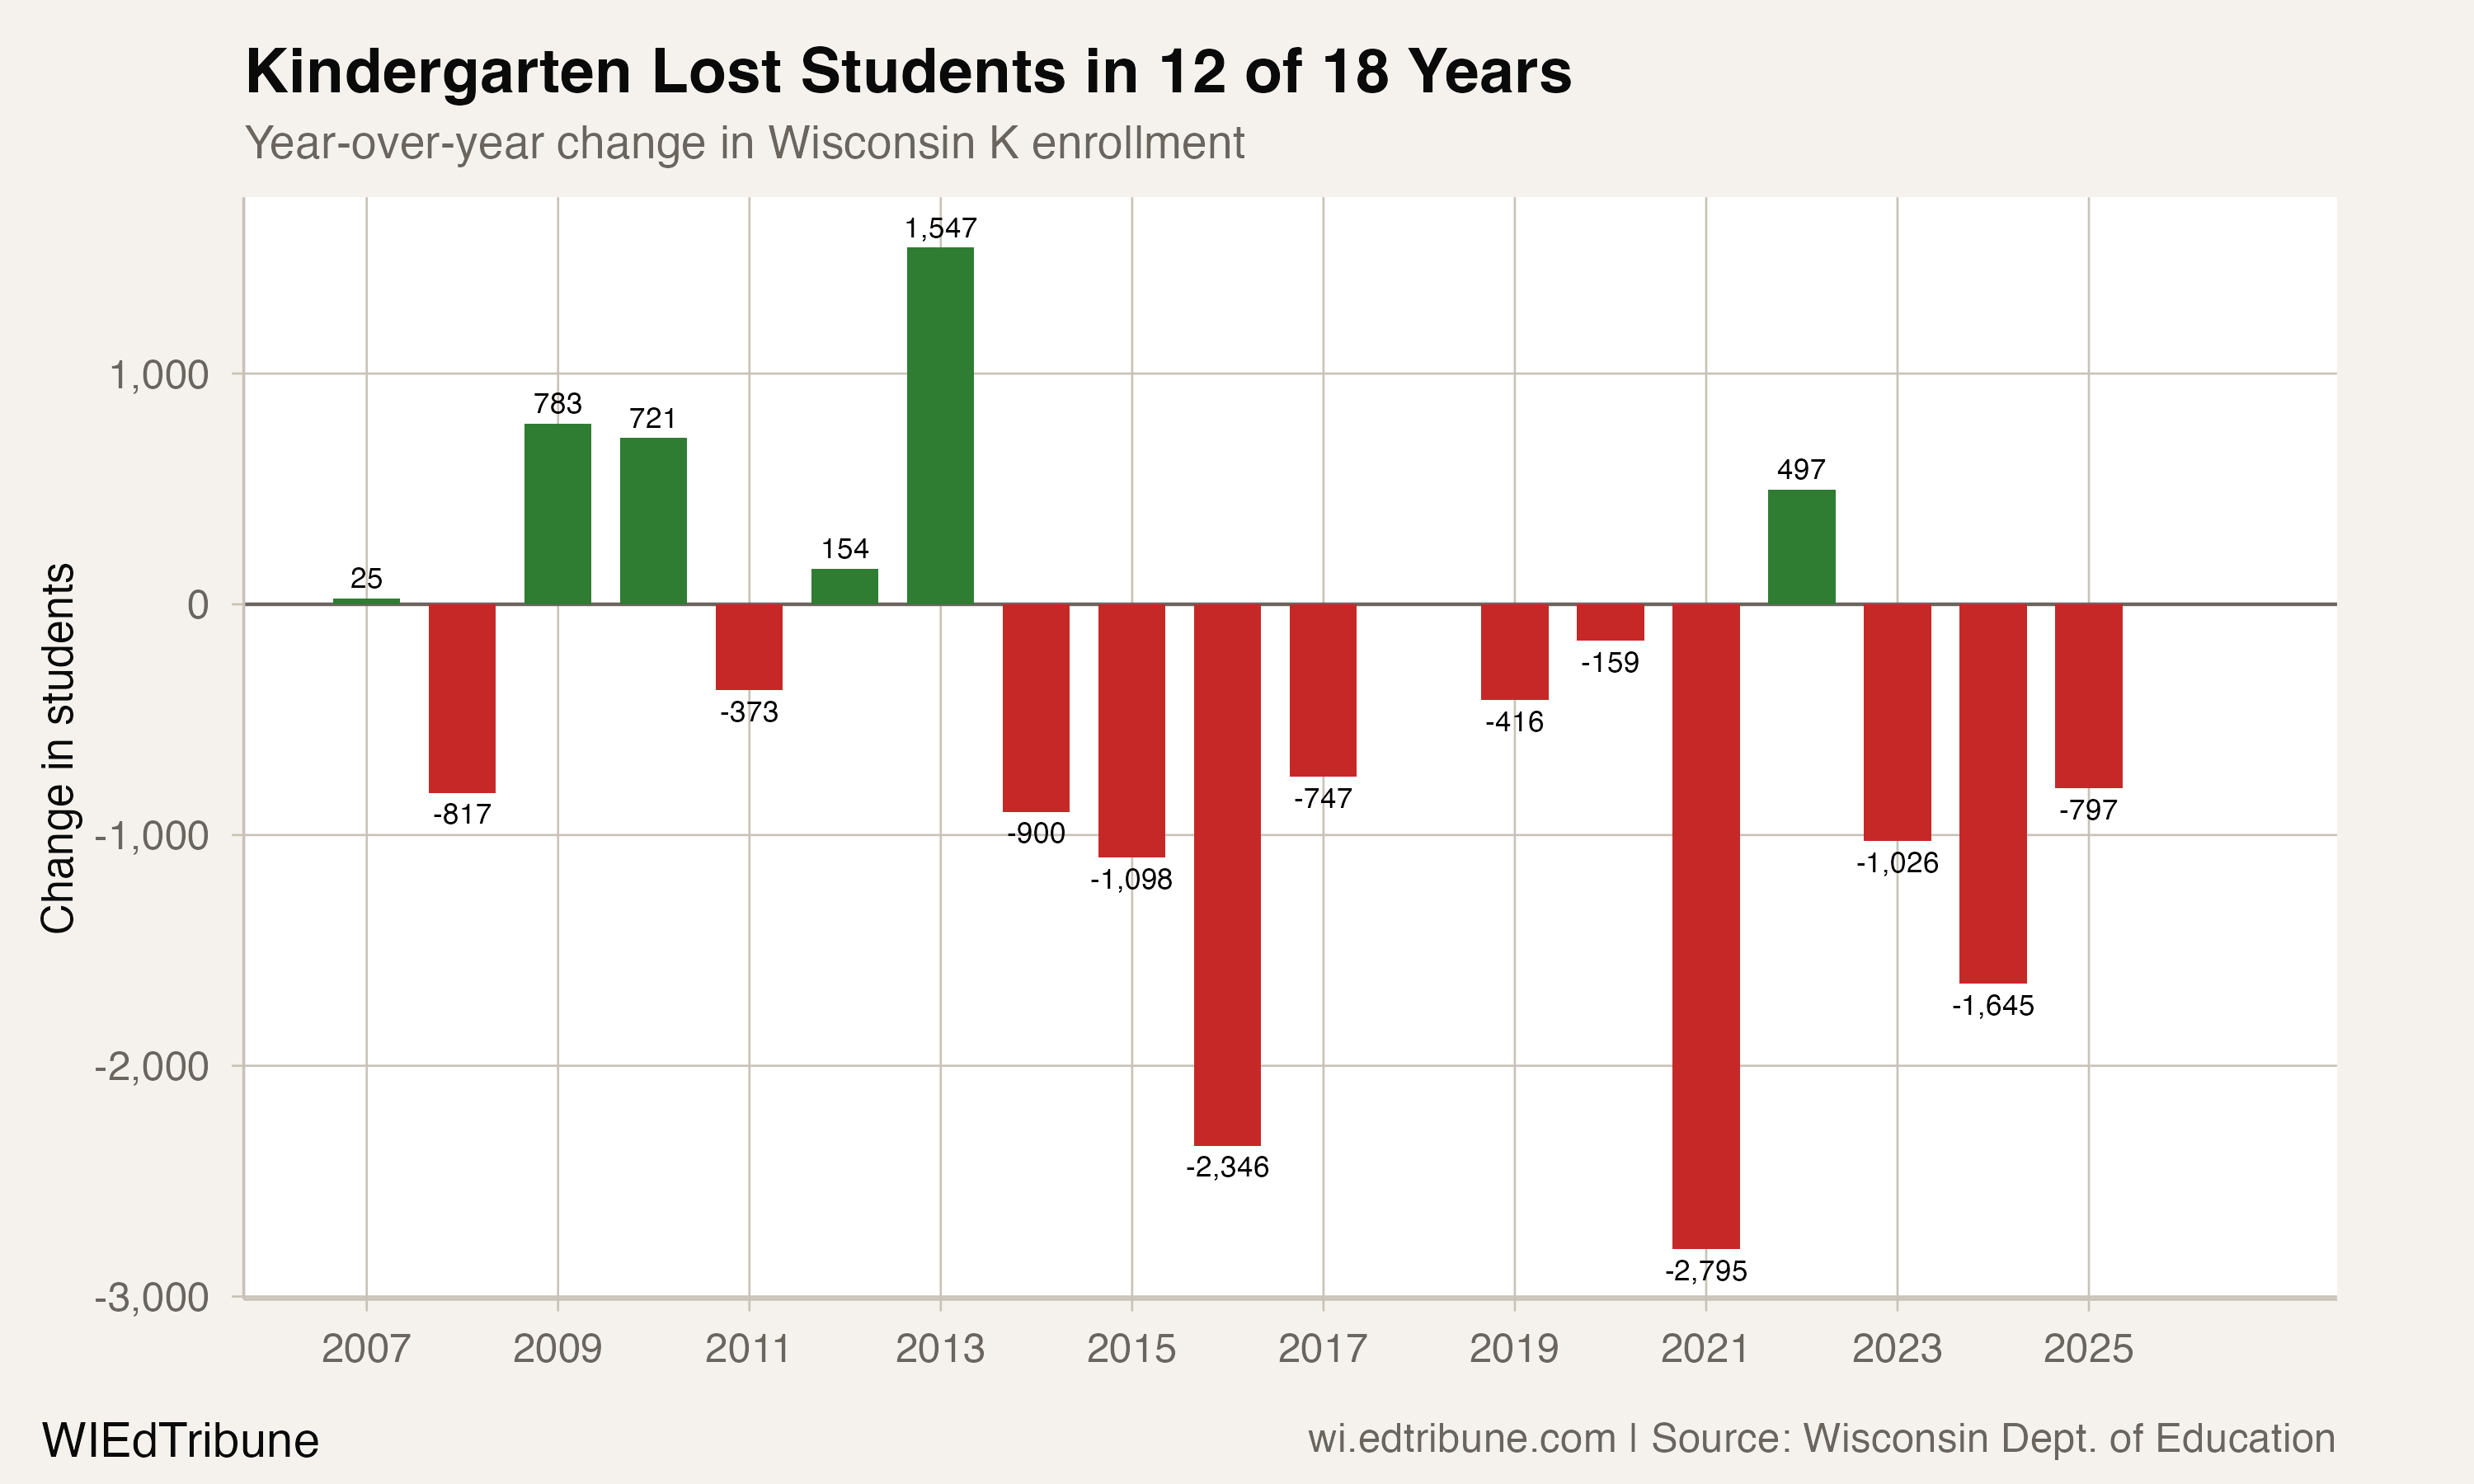
The observed series establishes the direction and size of past changes. It does not establish birth rates, migration, school-choice decisions, building closures, or future grade counts as mechanisms or outcomes.
Detailed code that reproduces the analysis and figures in this article is available exclusively to EdTribune subscribers.
Discussion
Sign in to join the discussion.
Loading comments...