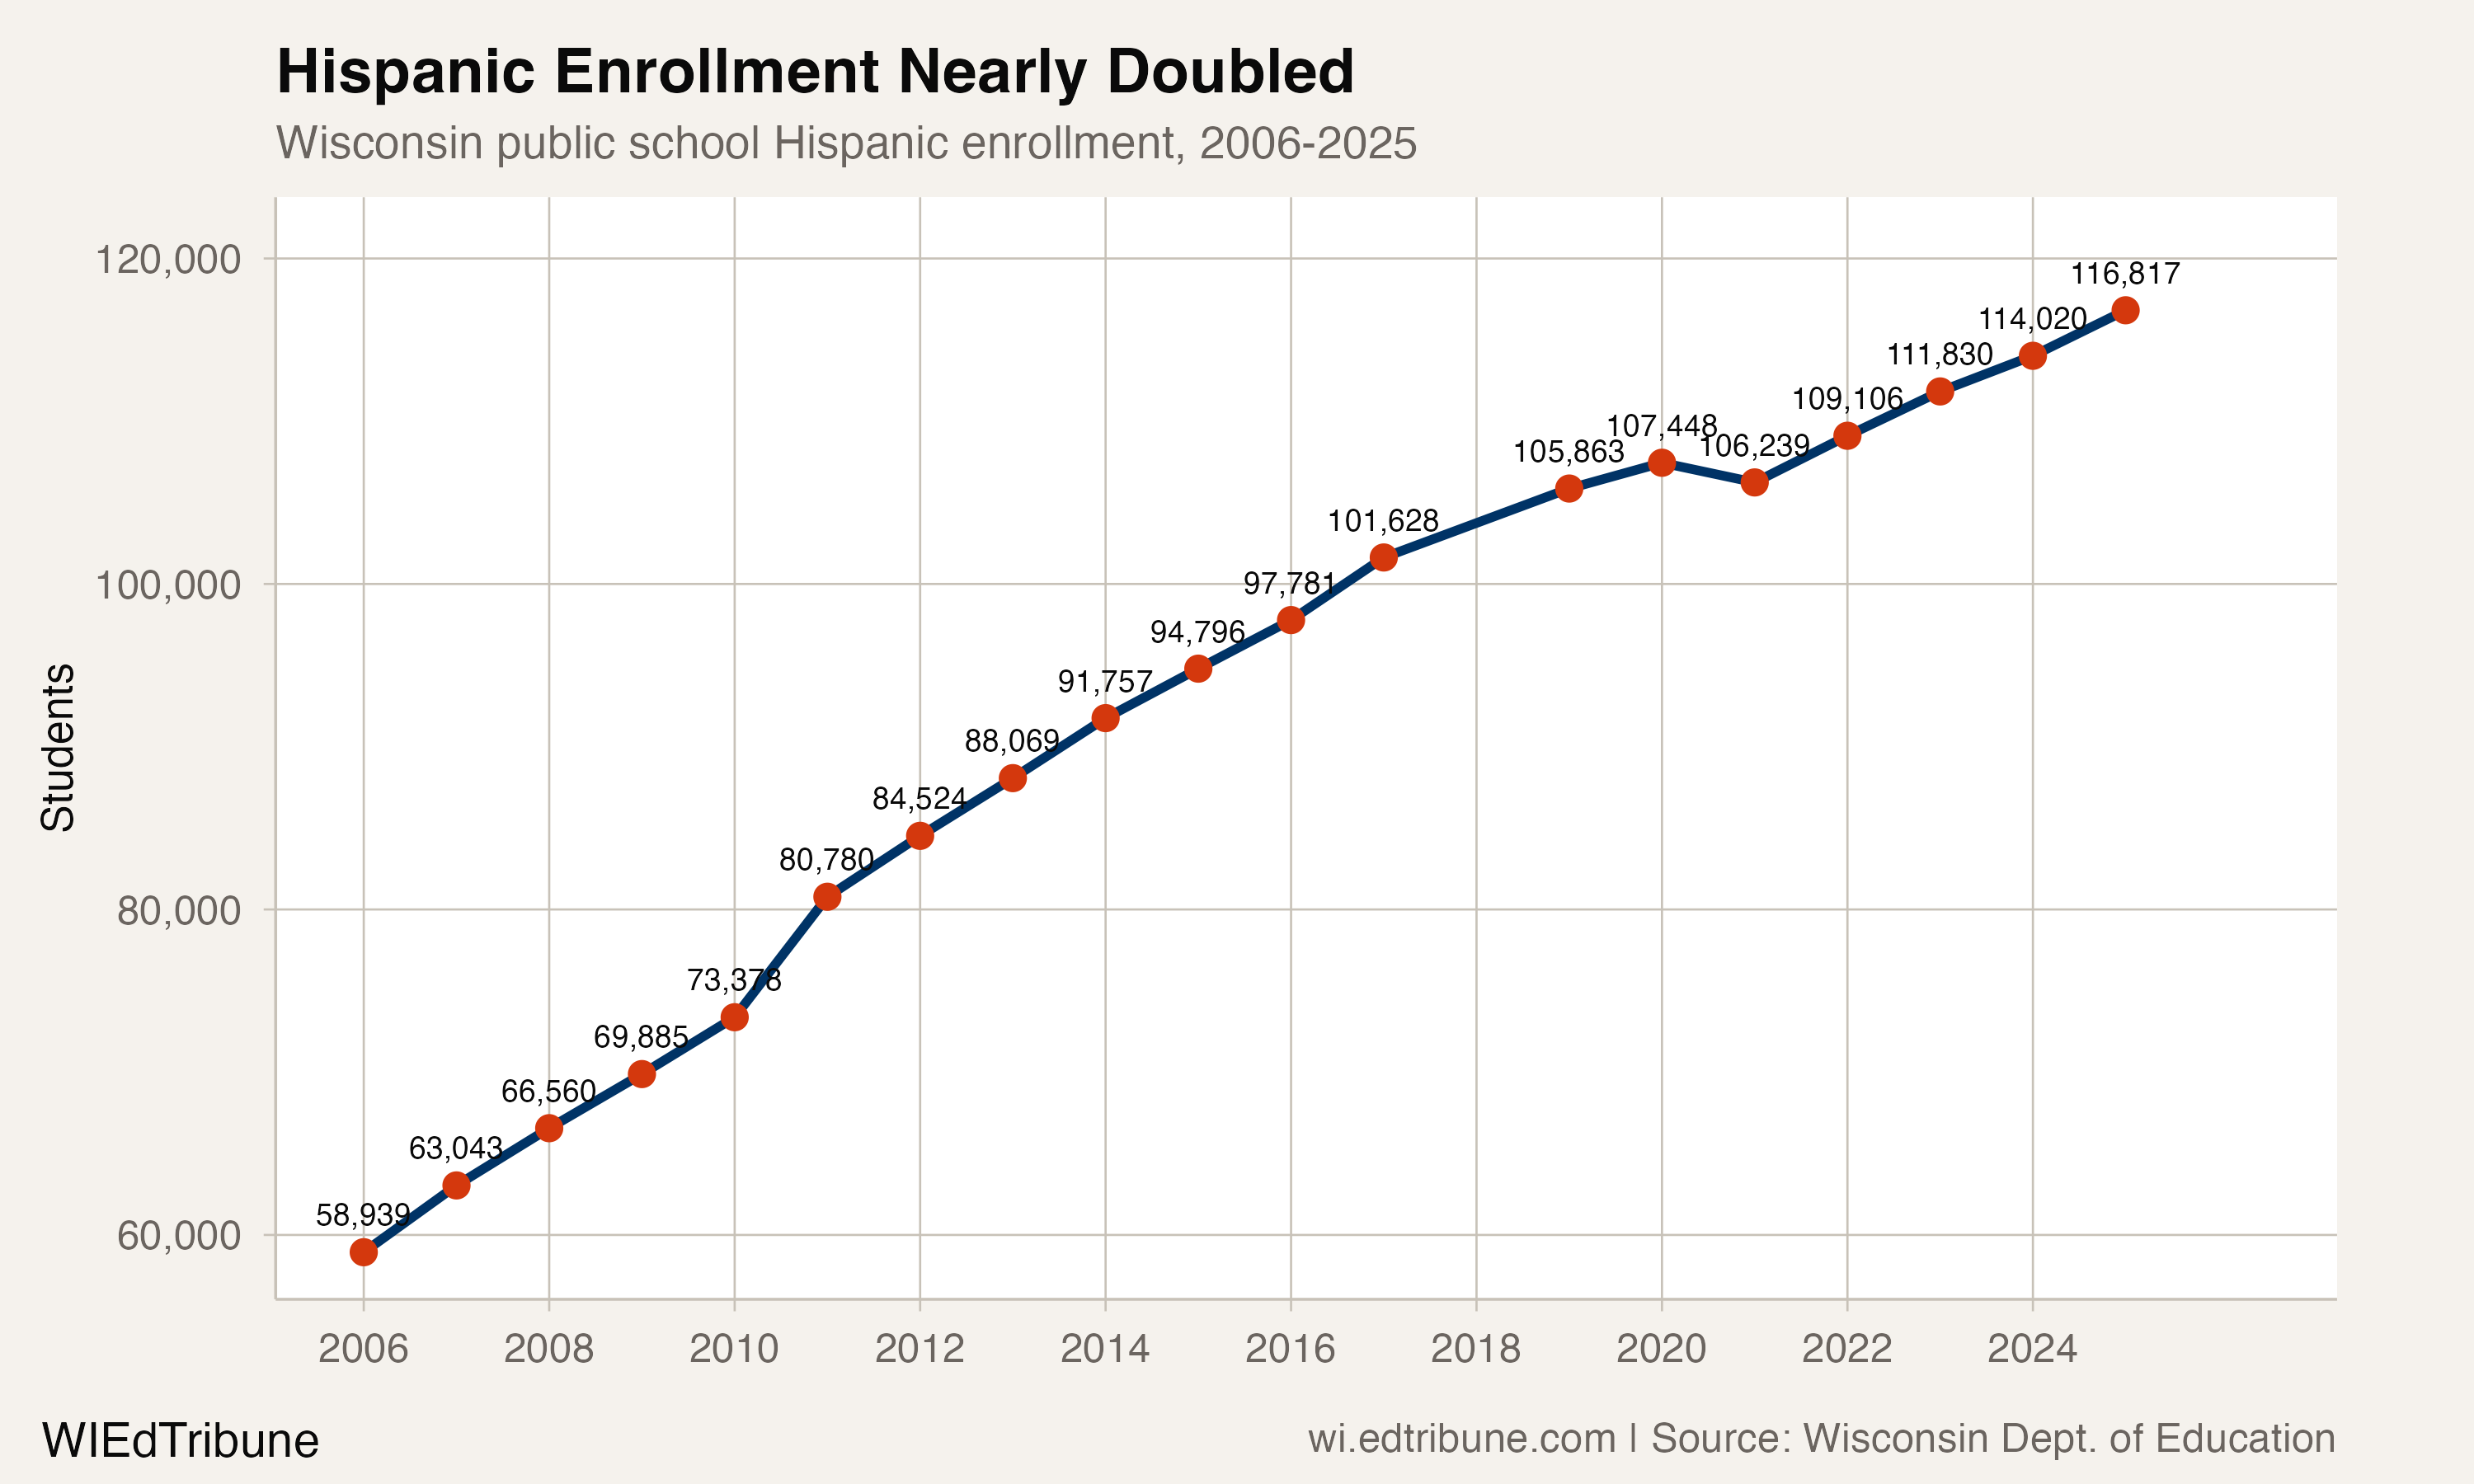
In 2006, roughly one in 15 Wisconsin public school students was Hispanic. By 2025, it was one in seven. That shift, from 58,939 students to 116,817, represents a 98.2% increase over 19 years, and it happened while the state's total enrollment dropped by 67,640 students, or 7.7%.
Hispanic students are now Wisconsin's second-largest demographic group, having surpassed Black enrollment in 2013. The growth is concentrated not in Milwaukee or Madison but in small agricultural and meatpacking towns where dairy farms and processing plants drew families from Mexico and Central America. In Arcadia↗ET, 79.0% of students are Hispanic. In Abbotsford↗ET, 66.2%. In Delavan-Darien↗ET, 52.3%.
The arithmetic that masks a deeper decline
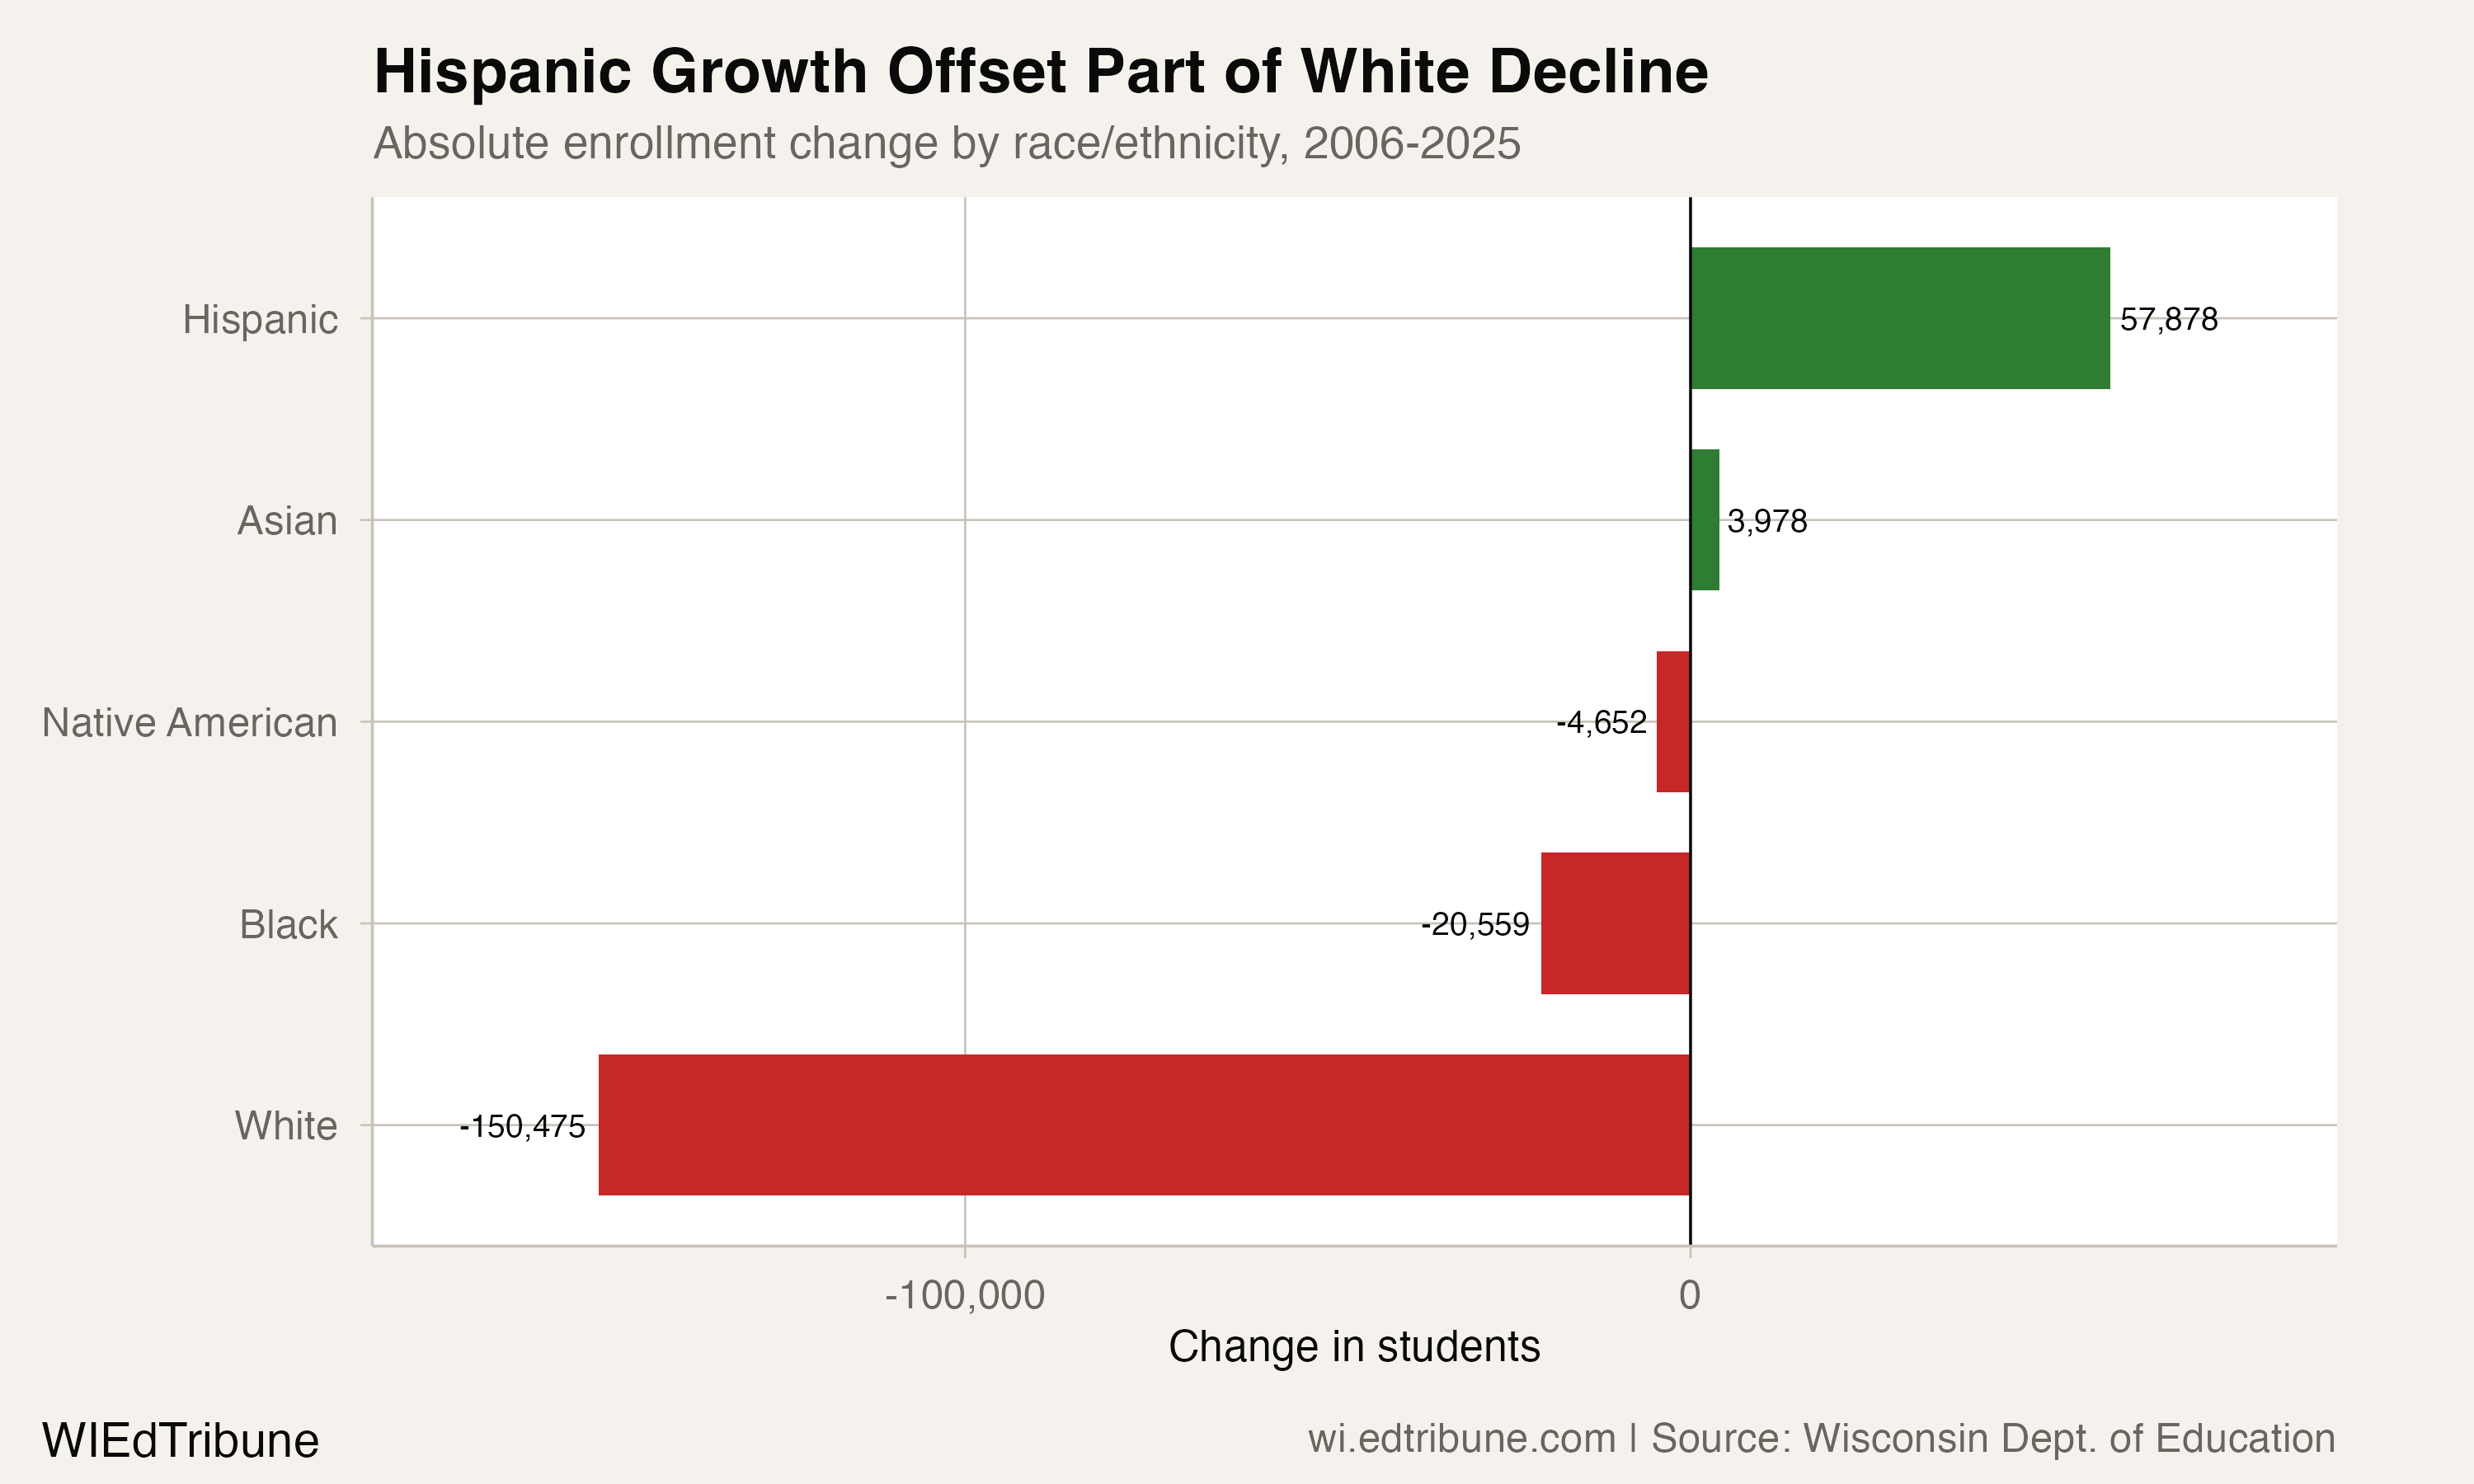
The 57,878 Hispanic students Wisconsin added since 2006 absorbed nearly half of what would otherwise have been a far steeper enrollment collapse. White enrollment fell by 150,475 over the same period, a 22.1% decline. Black enrollment dropped 22.6%. Without Hispanic growth, Wisconsin's total enrollment decline would have been 125,518 rather than 67,640.
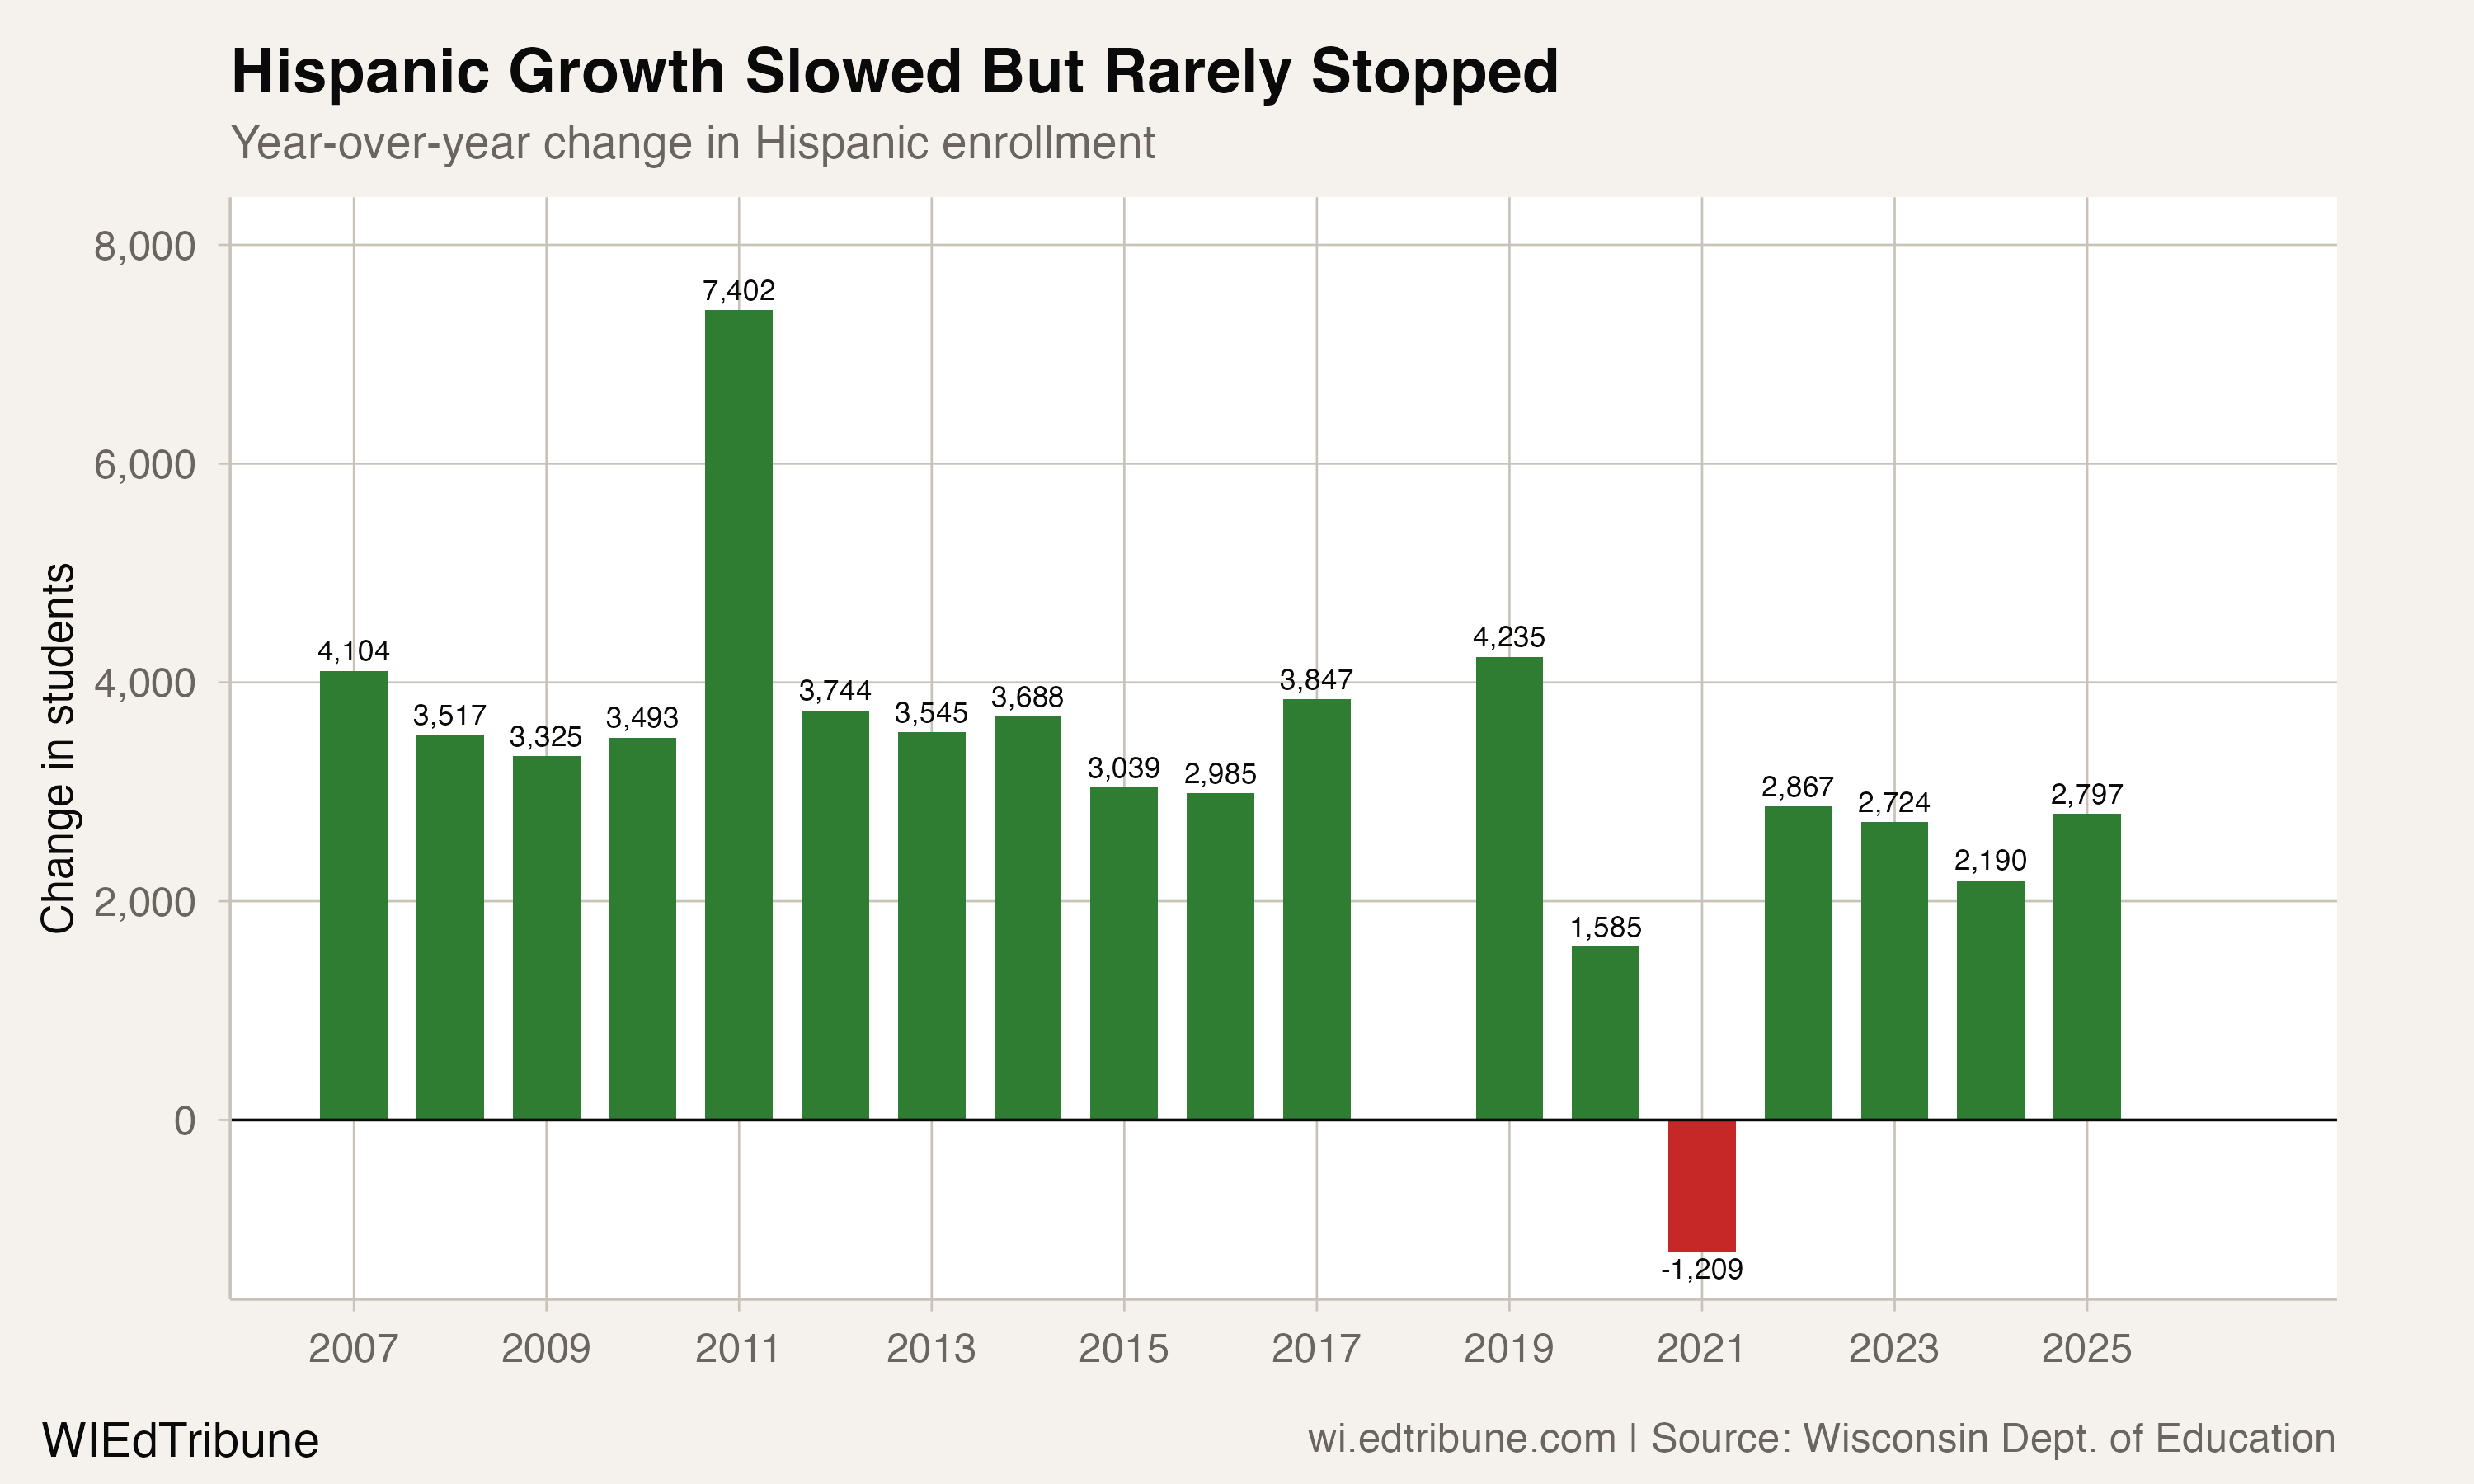
Hispanic enrollment grew in 17 of 18 observed year-over-year transitions, declining only once, by 1,209 students in 2020-21, during the pandemic. The growth resumed immediately: Wisconsin added 2,867 Hispanic students in 2021-22 and 2,797 more in 2024-25.
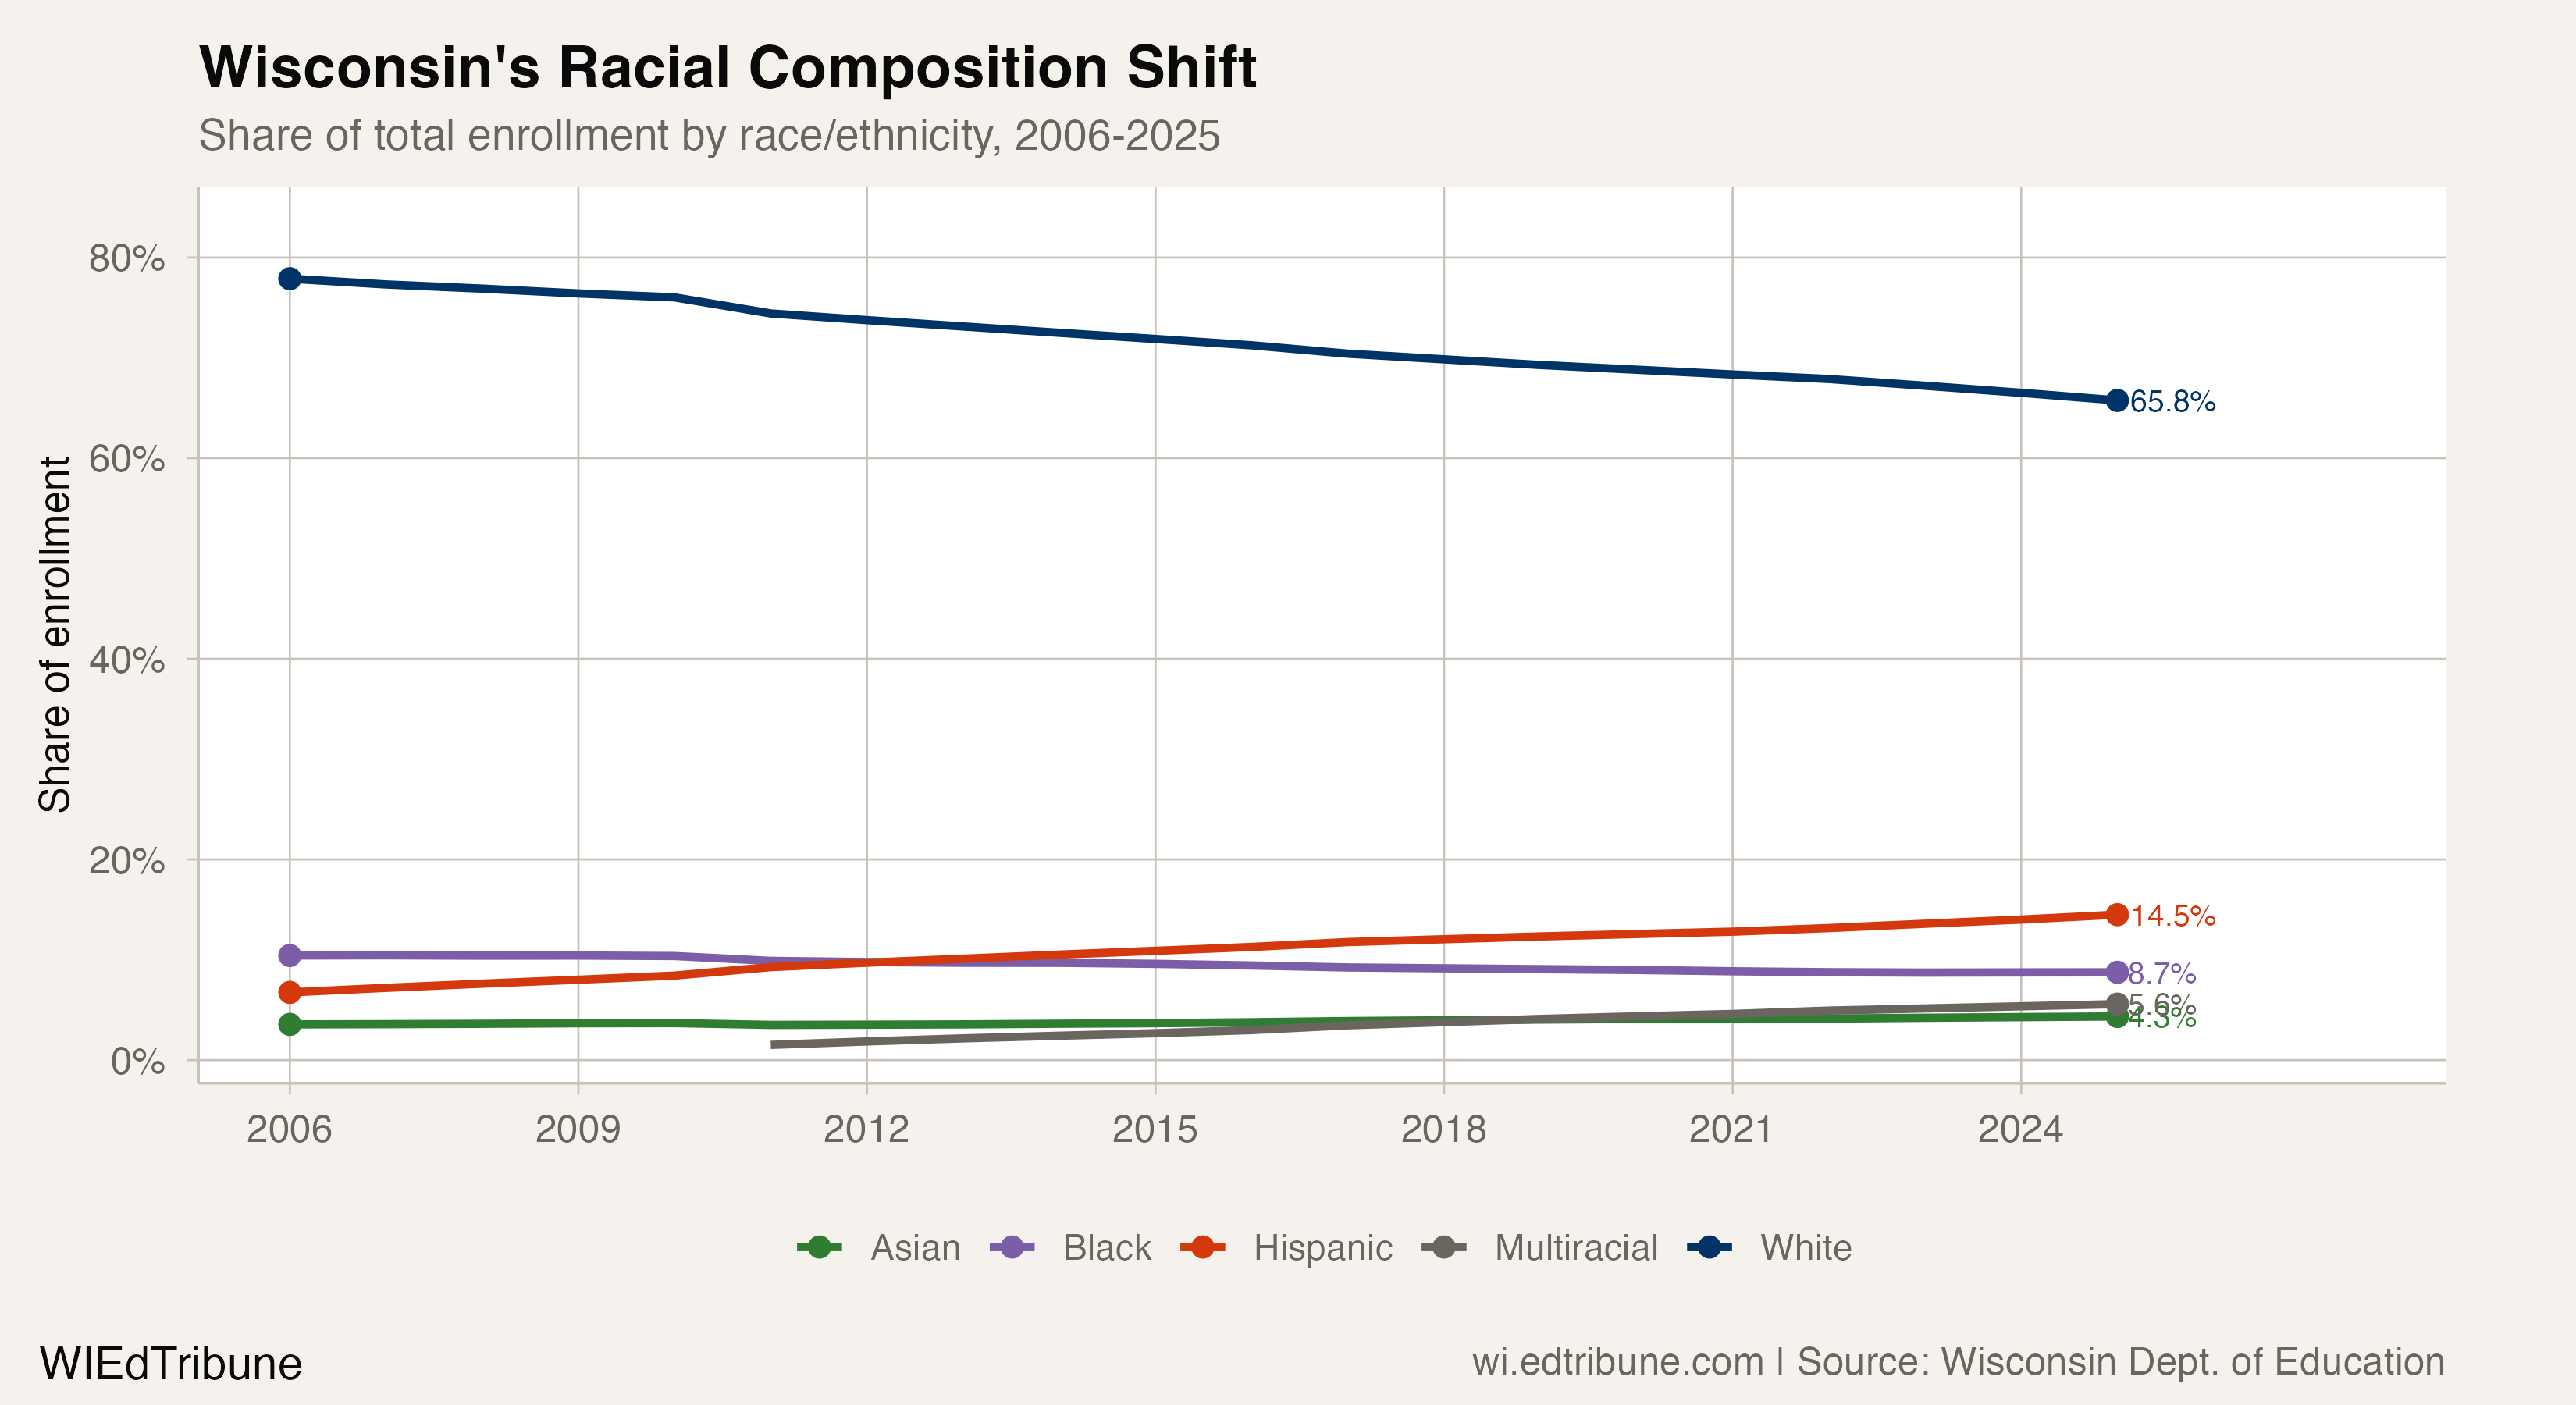
The composition shift is visible at every level. White students went from 77.9% of enrollment to 65.8%. Hispanic students went from 6.7% to 14.5%, a gain of 7.7 percentage points. Black students declined from 10.4% to 8.7%. Asian students, buoyed in part by Wisconsin's Hmong community (the third-largest in the nation), edged up from 3.6% to 4.3%.
Where dairy and poultry built school districts
The districts with the highest Hispanic enrollment shares tell a specific economic story. Arcadia↗ET, population 3,100, is home to both a Pilgrim's Pride poultry processing plant and an Ashley Furniture manufacturing campus that employs roughly 3,500 workers. Abbotsford↗ET hosts Abbyland Foods, the city's largest employer. Independence↗ET, at 54.4% Hispanic, sits in the same Trempealeau County dairy corridor as Arcadia.
These are not bedroom communities absorbing suburban sprawl. They are towns where a single employer or industry created labor demand that reshaped the school system within a generation. Arcadia's school district was more than two-thirds white as recently as 2011. By 2025, it was 79.0% Hispanic. Without the influx of Hispanic students, the district's enrollment would be roughly a fifth of its current 1,303.
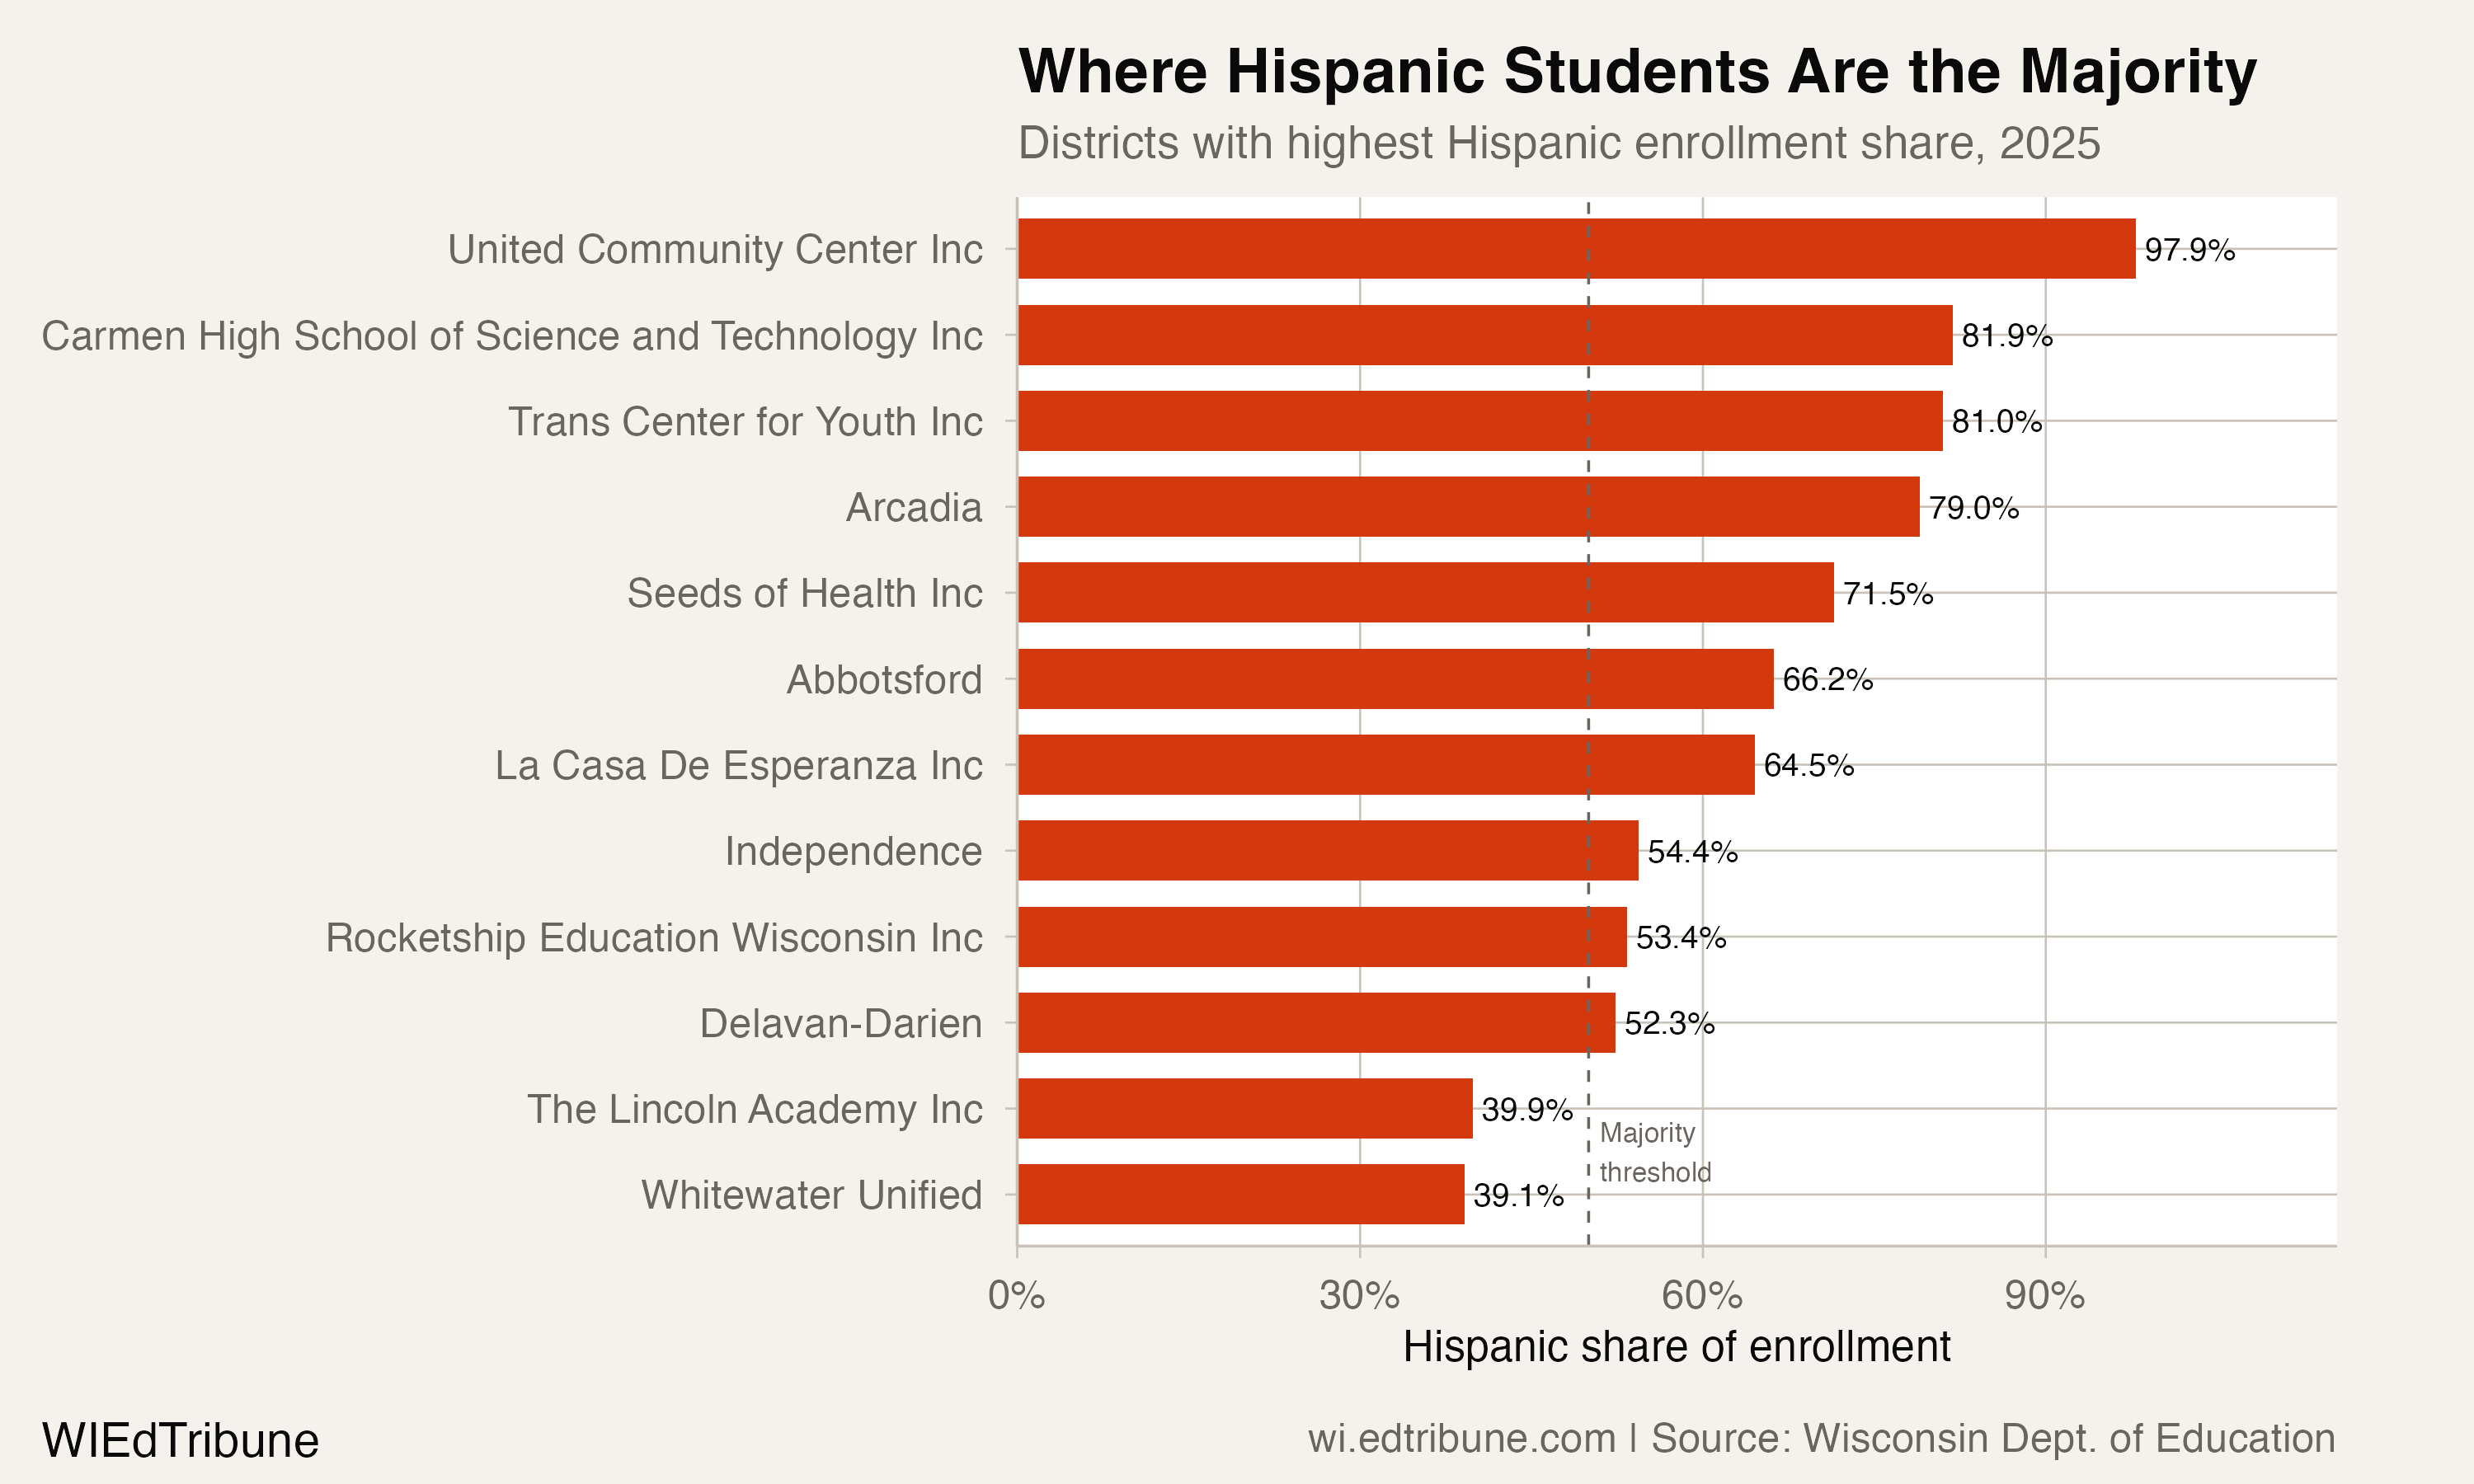
Ten districts now have Hispanic-majority enrollment, including several Milwaukee-area charter schools (United Community Center at 97.9%, Carmen High School of Science and Technology at 81.9%) alongside the rural districts. Among traditional public school districts, four have crossed the 50% threshold: Arcadia, Abbotsford, Independence, and Delavan-Darien.
The dairy workforce pipeline
The most direct driver of Hispanic enrollment growth in rural Wisconsin is the dairy industry's structural dependence on immigrant labor. A 2023 University of Wisconsin-Madison School for Workers survey found that over 10,000 undocumented workers perform approximately 70% of the labor on Wisconsin dairy farms. Because no visa covers year-round dairy work, thousands of these workers have no legal path to permanent status, yet their children attend local schools.
"Without them, the whole dairy industry would collapse overnight." -- UW-Madison School for Workers study, as reported by Wisconsin Watch, Jan. 2025
An estimated 70,000 undocumented immigrants live in Wisconsin, with roughly 47,000 employed, contributing $240 million in federal, state, and local taxes as of 2022. The top industry is manufacturing (11,000 workers), followed by professional services (8,000), food services (5,000), construction (5,000), and agriculture (5,000). These employment concentrations correspond directly to the districts where Hispanic enrollment has grown fastest: Madison Metropolitan↗ET (+3,684 Hispanic students since 2006), Kenosha↗ET (+2,261), Appleton Area↗ET (+1,251), and Green Bay Area Public↗ET, where 34.9% of students are now Hispanic.
Growth in the largest districts
The absolute numbers tell a different story from the rural percentages. Milwaukee↗ET, despite its overall enrollment collapse, remains the district with the most Hispanic students: 18,927, or 28.9% of its enrollment. Kenosha↗ET is at 32.6%, Racine↗ET at 33.8%, and Green Bay at 34.9%.
Madison Metropolitan added more Hispanic students than any other district, 3,684, pushing its Hispanic share from 11.6% to 25.9%. Beloit↗ET, a small southern Wisconsin city, is 37.1% Hispanic. In several of these districts, Hispanic enrollment growth is the only reason enrollment did not fall further than it did.
A staffing system built for a different student body
The enrollment data does not include English learner status by race, but the overlap between Hispanic enrollment growth and English learner demand is substantial. Wisconsin DPI reports that 25,427 English learner students were served in bilingual-bicultural programs in 2024-25, approximately 45% of all EL students in the state. Less than half of eligible students are receiving bilingual instruction.
Wisconsin has been designated a bilingual teacher shortage state for the 2024-25 school year by the U.S. Department of Education. The UW-Madison School of Education launched a certificate program in 2022 to allow licensed teachers who are Spanish-proficient to obtain bilingual-bicultural certification in one year, an acknowledgment that conventional pipeline timelines cannot keep pace with classroom need.
The 2011 anomaly and what it reveals
The largest single-year jump in Hispanic enrollment, 7,402 students in 2010-11, coincided with the federal government's adoption of new race and ethnicity reporting categories that separated Hispanic origin from race for the first time. Some portion of that spike likely reflects reclassification of students who were previously counted under other categories rather than new arrivals. The 2011 jump also introduced the "multiracial" category, which has grown 240.7% since its first year. Any trend analysis that draws a straight line from 2006 through 2011 to 2025 overstates the pace of actual demographic change. The growth before 2011 averaged roughly 3,600 students per year. After 2011 (excluding the reclassification year), it averaged roughly 2,700.
Immigration enforcement and what comes next
Recent federal immigration enforcement has introduced new uncertainty into this trend. ICE actions in Manitowoc County and E-Verify-driven labor disputes at Wisconsin dairy operations in 2025 have created acute staffing shortages and community anxiety, particularly in the small towns where Hispanic enrollment is most concentrated.
The Abbotsford School District, where 66.2% of students are Hispanic, reported families expressing fear of deportation following increased enforcement activity. Whether that fear translates into enrollment declines in 2025-26 and beyond is not yet visible in the data.
The question for Wisconsin is whether the demographic shift that has sustained school enrollment across hundreds of communities for two decades will continue, slow, or reverse. The dairy industry's labor needs have not changed. The poultry plants and furniture factories still operate. But the policy environment surrounding the workers who fill those jobs, and whose children fill those classrooms, is shifting in ways the enrollment data cannot yet measure.
Detailed code that reproduces the analysis and figures in this article is available exclusively to EdTribune subscribers.
Discussion
Sign in to join the discussion.
Loading comments...