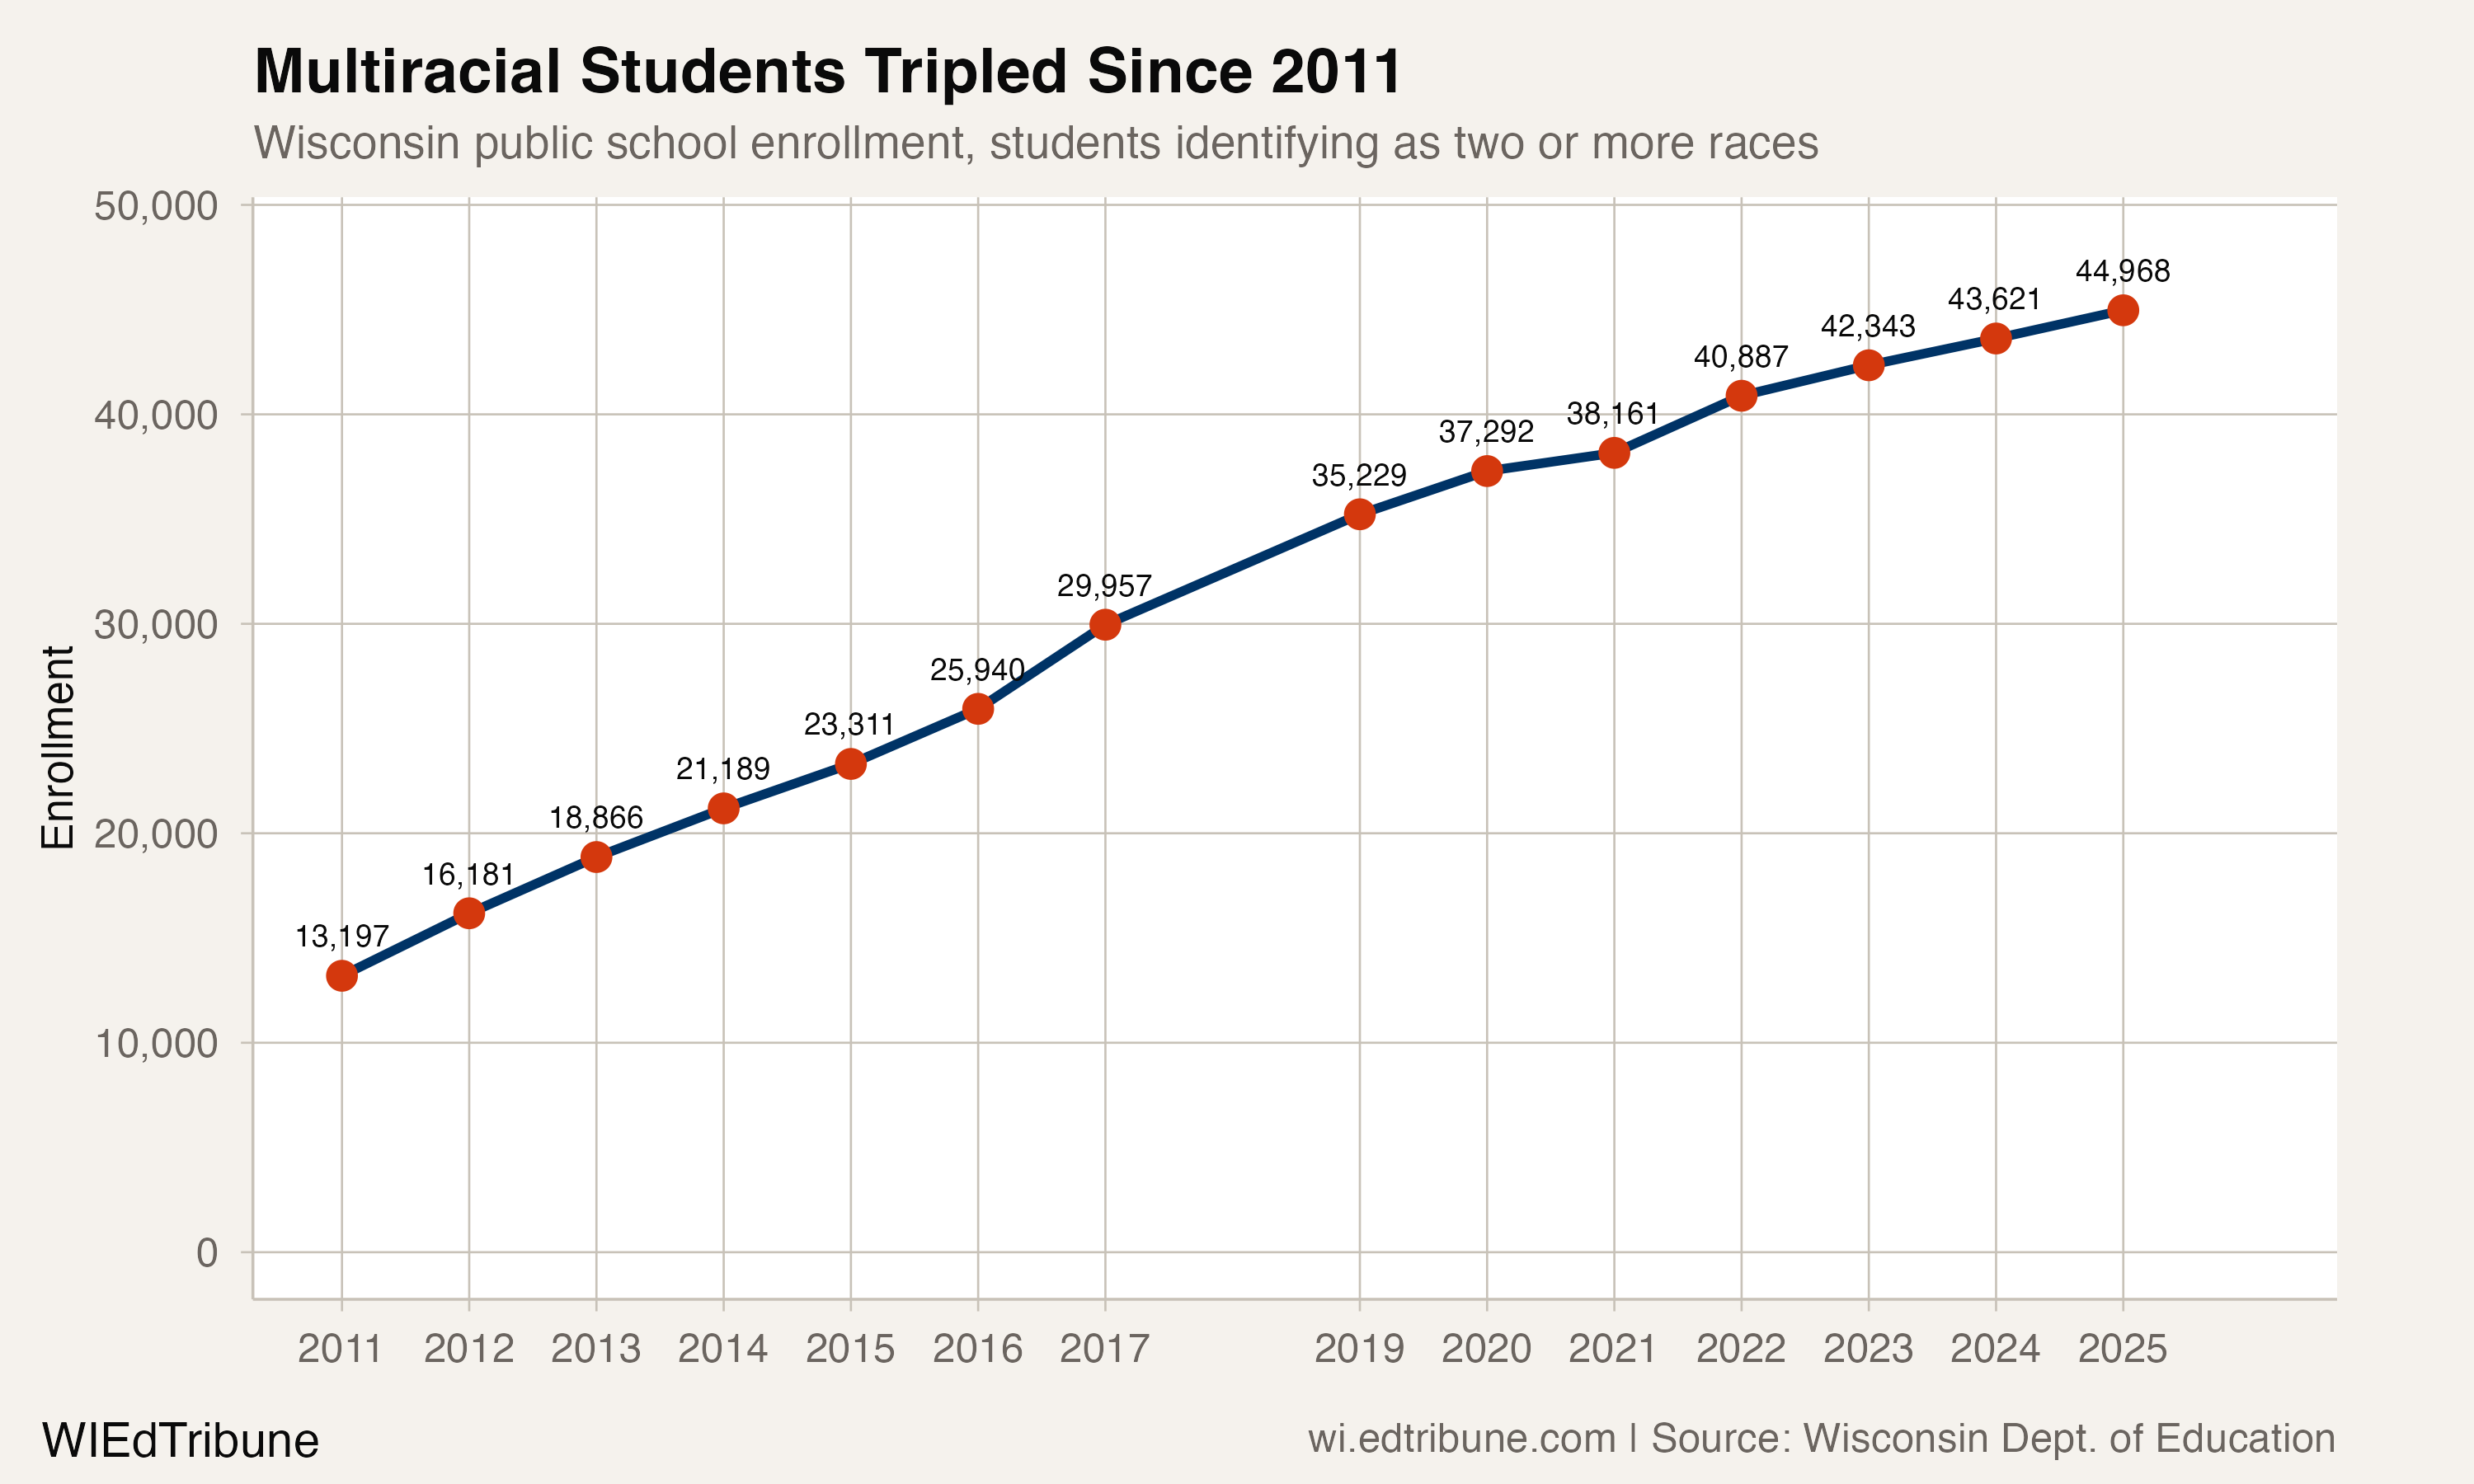
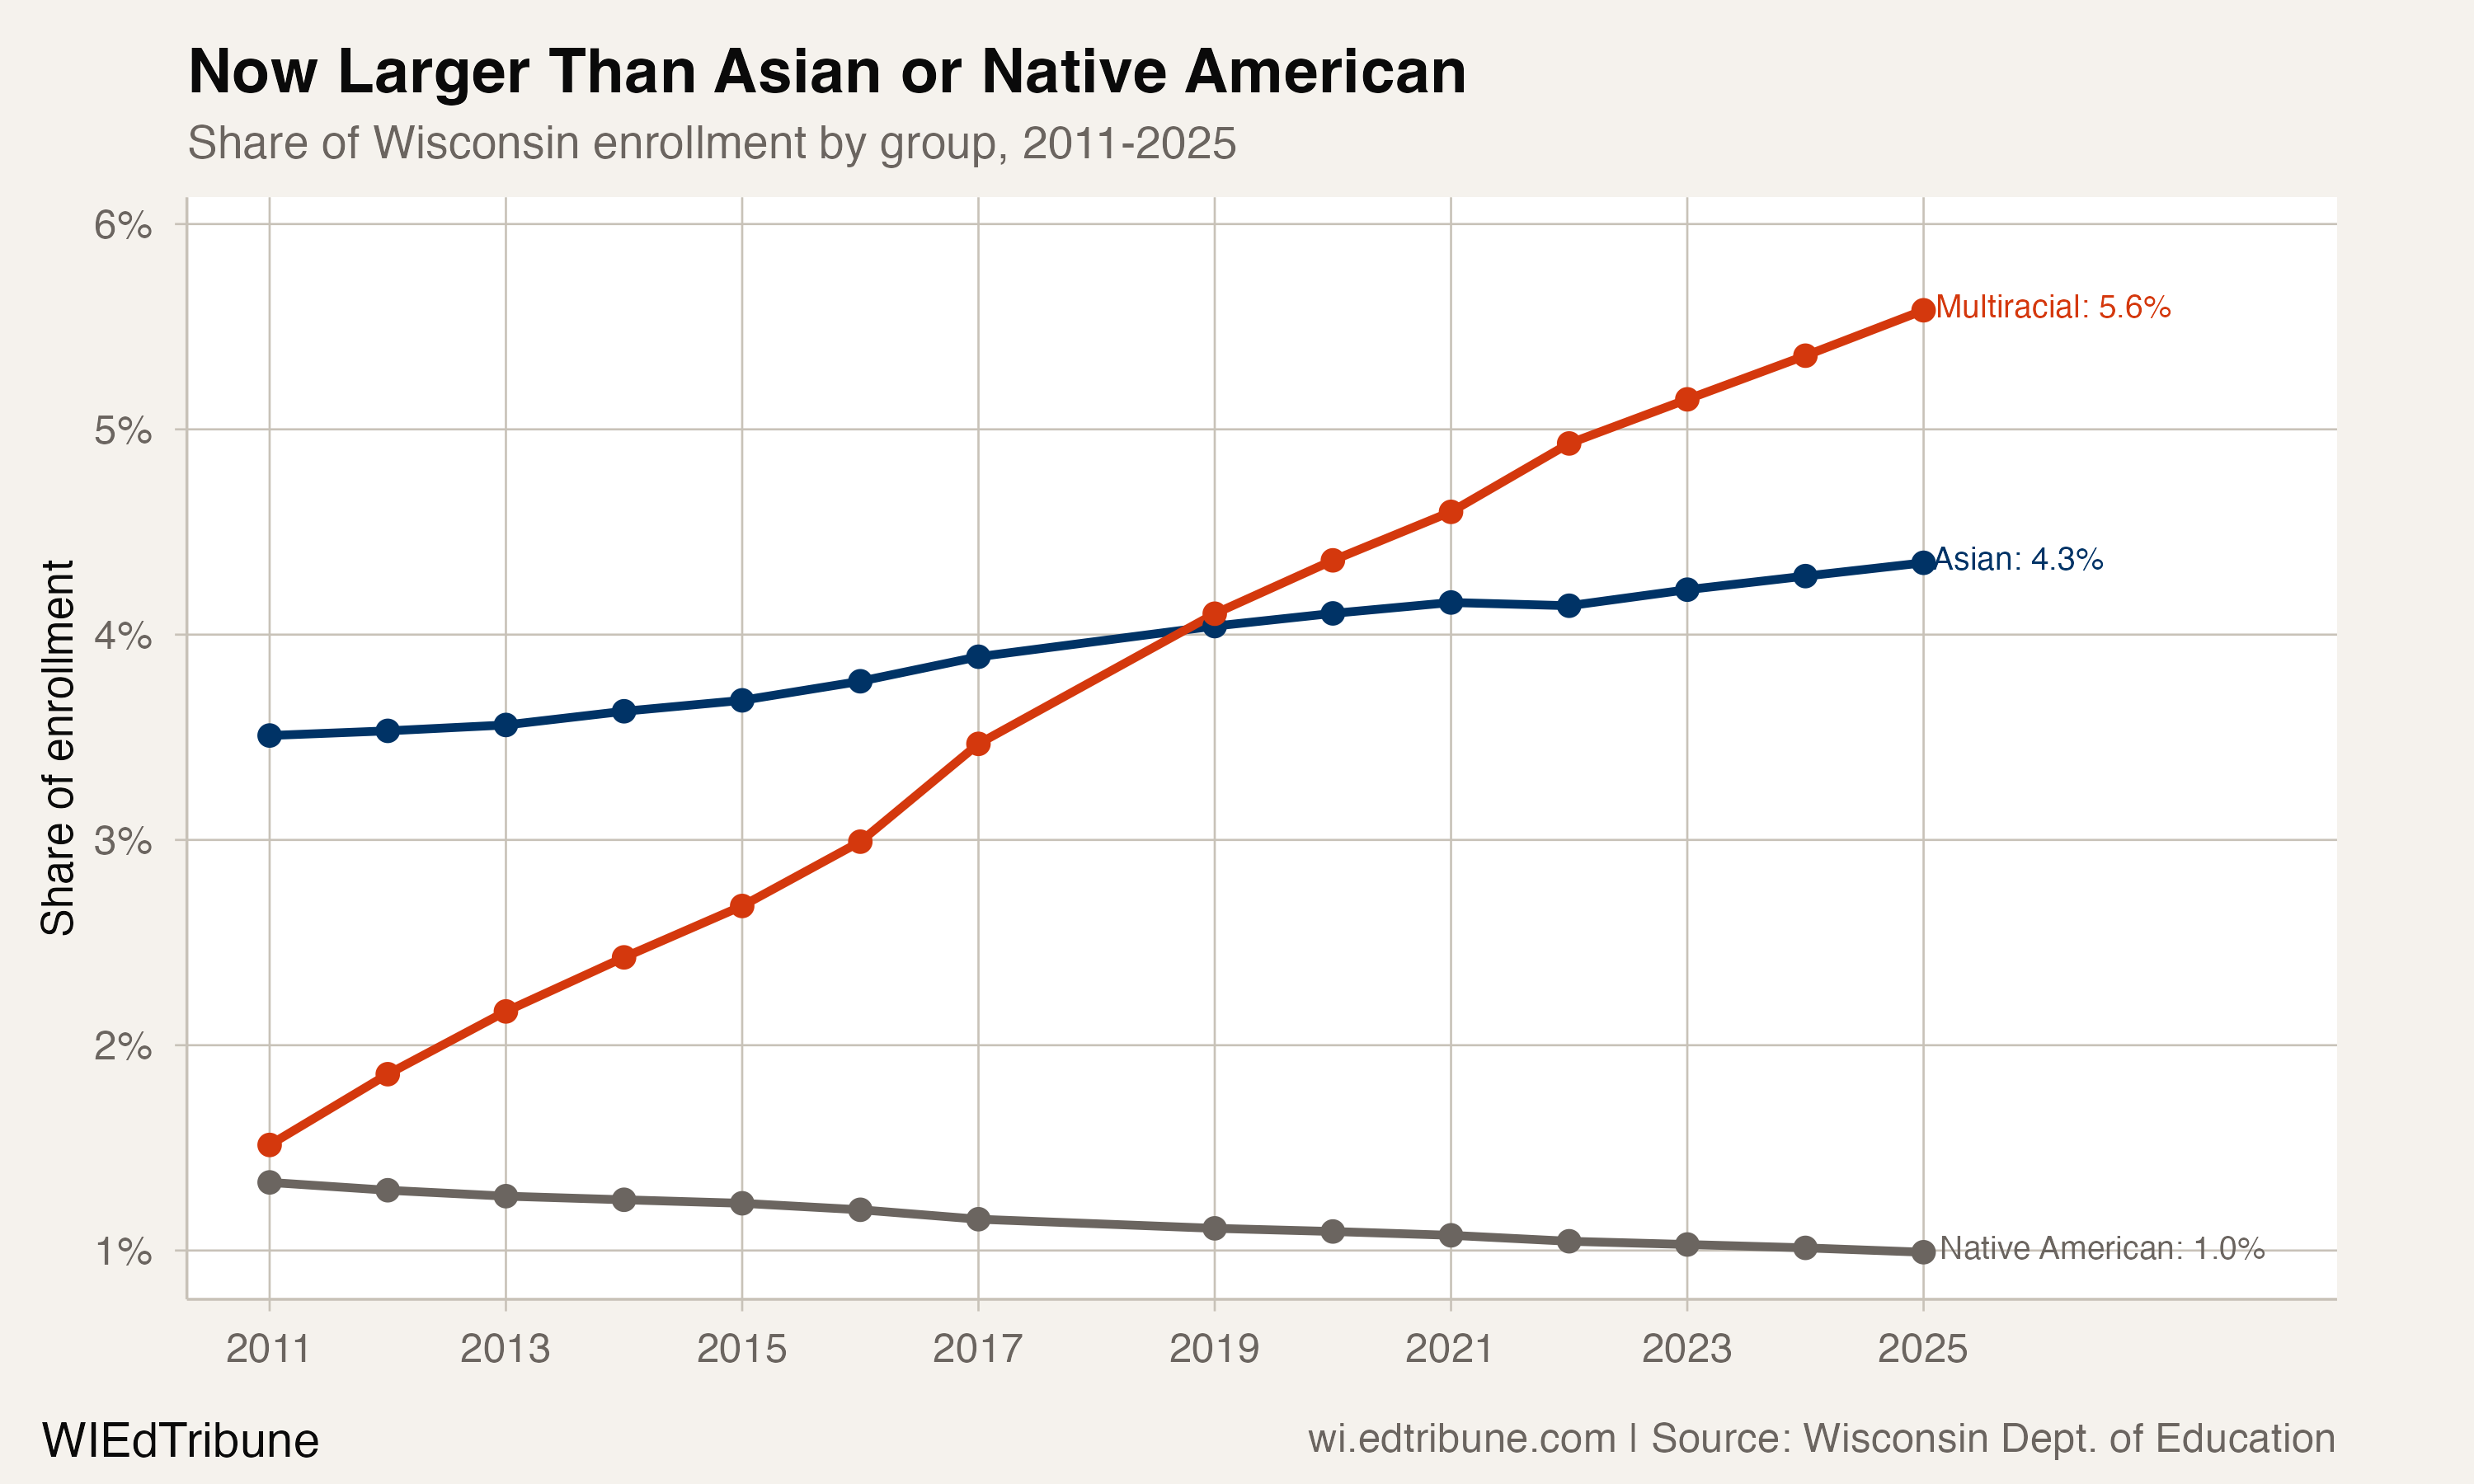
In 2011, when federal reporting rules first required Wisconsin schools to count students identifying as two or more races, the category barely registered: 13,197 students, 1.5% of enrollment. Fourteen years later, 44,968 students check that box, 5.6% of the total. The 240.7% increase makes multiracial students the fastest-growing racial demographic in Wisconsin public schools, outpacing Hispanic growth (+44.6%) by a factor of five.
The surge is not unique to Wisconsin. Nationally, students identifying as two or more races grew from 1.4 million to 2.5 million between 2012 and 2022, a 79% increase. Wisconsin's growth over that same period was 153%, roughly double the national rate. The question that enrollment data alone cannot answer: how much of this reflects new multiracial families, and how much reflects existing families choosing a different box on the form?
From smallest to fourth-largest
In 2011, multiracial was the second-smallest racial category in Wisconsin schools, ahead of only Pacific Islander. By 2019, multiracial enrollment had overtaken Asian students (35,229 vs. 34,711) to become the fourth-largest group. By 2025, the gap had widened to nearly 10,000 students: 44,968 multiracial vs. 35,055 Asian.
The trajectory has moved in only one direction. Multiracial enrollment grew in every observed year since the category's introduction, including during the pandemic, when it added 2,932 students between 2019 and 2021 while statewide enrollment fell by 25,024.
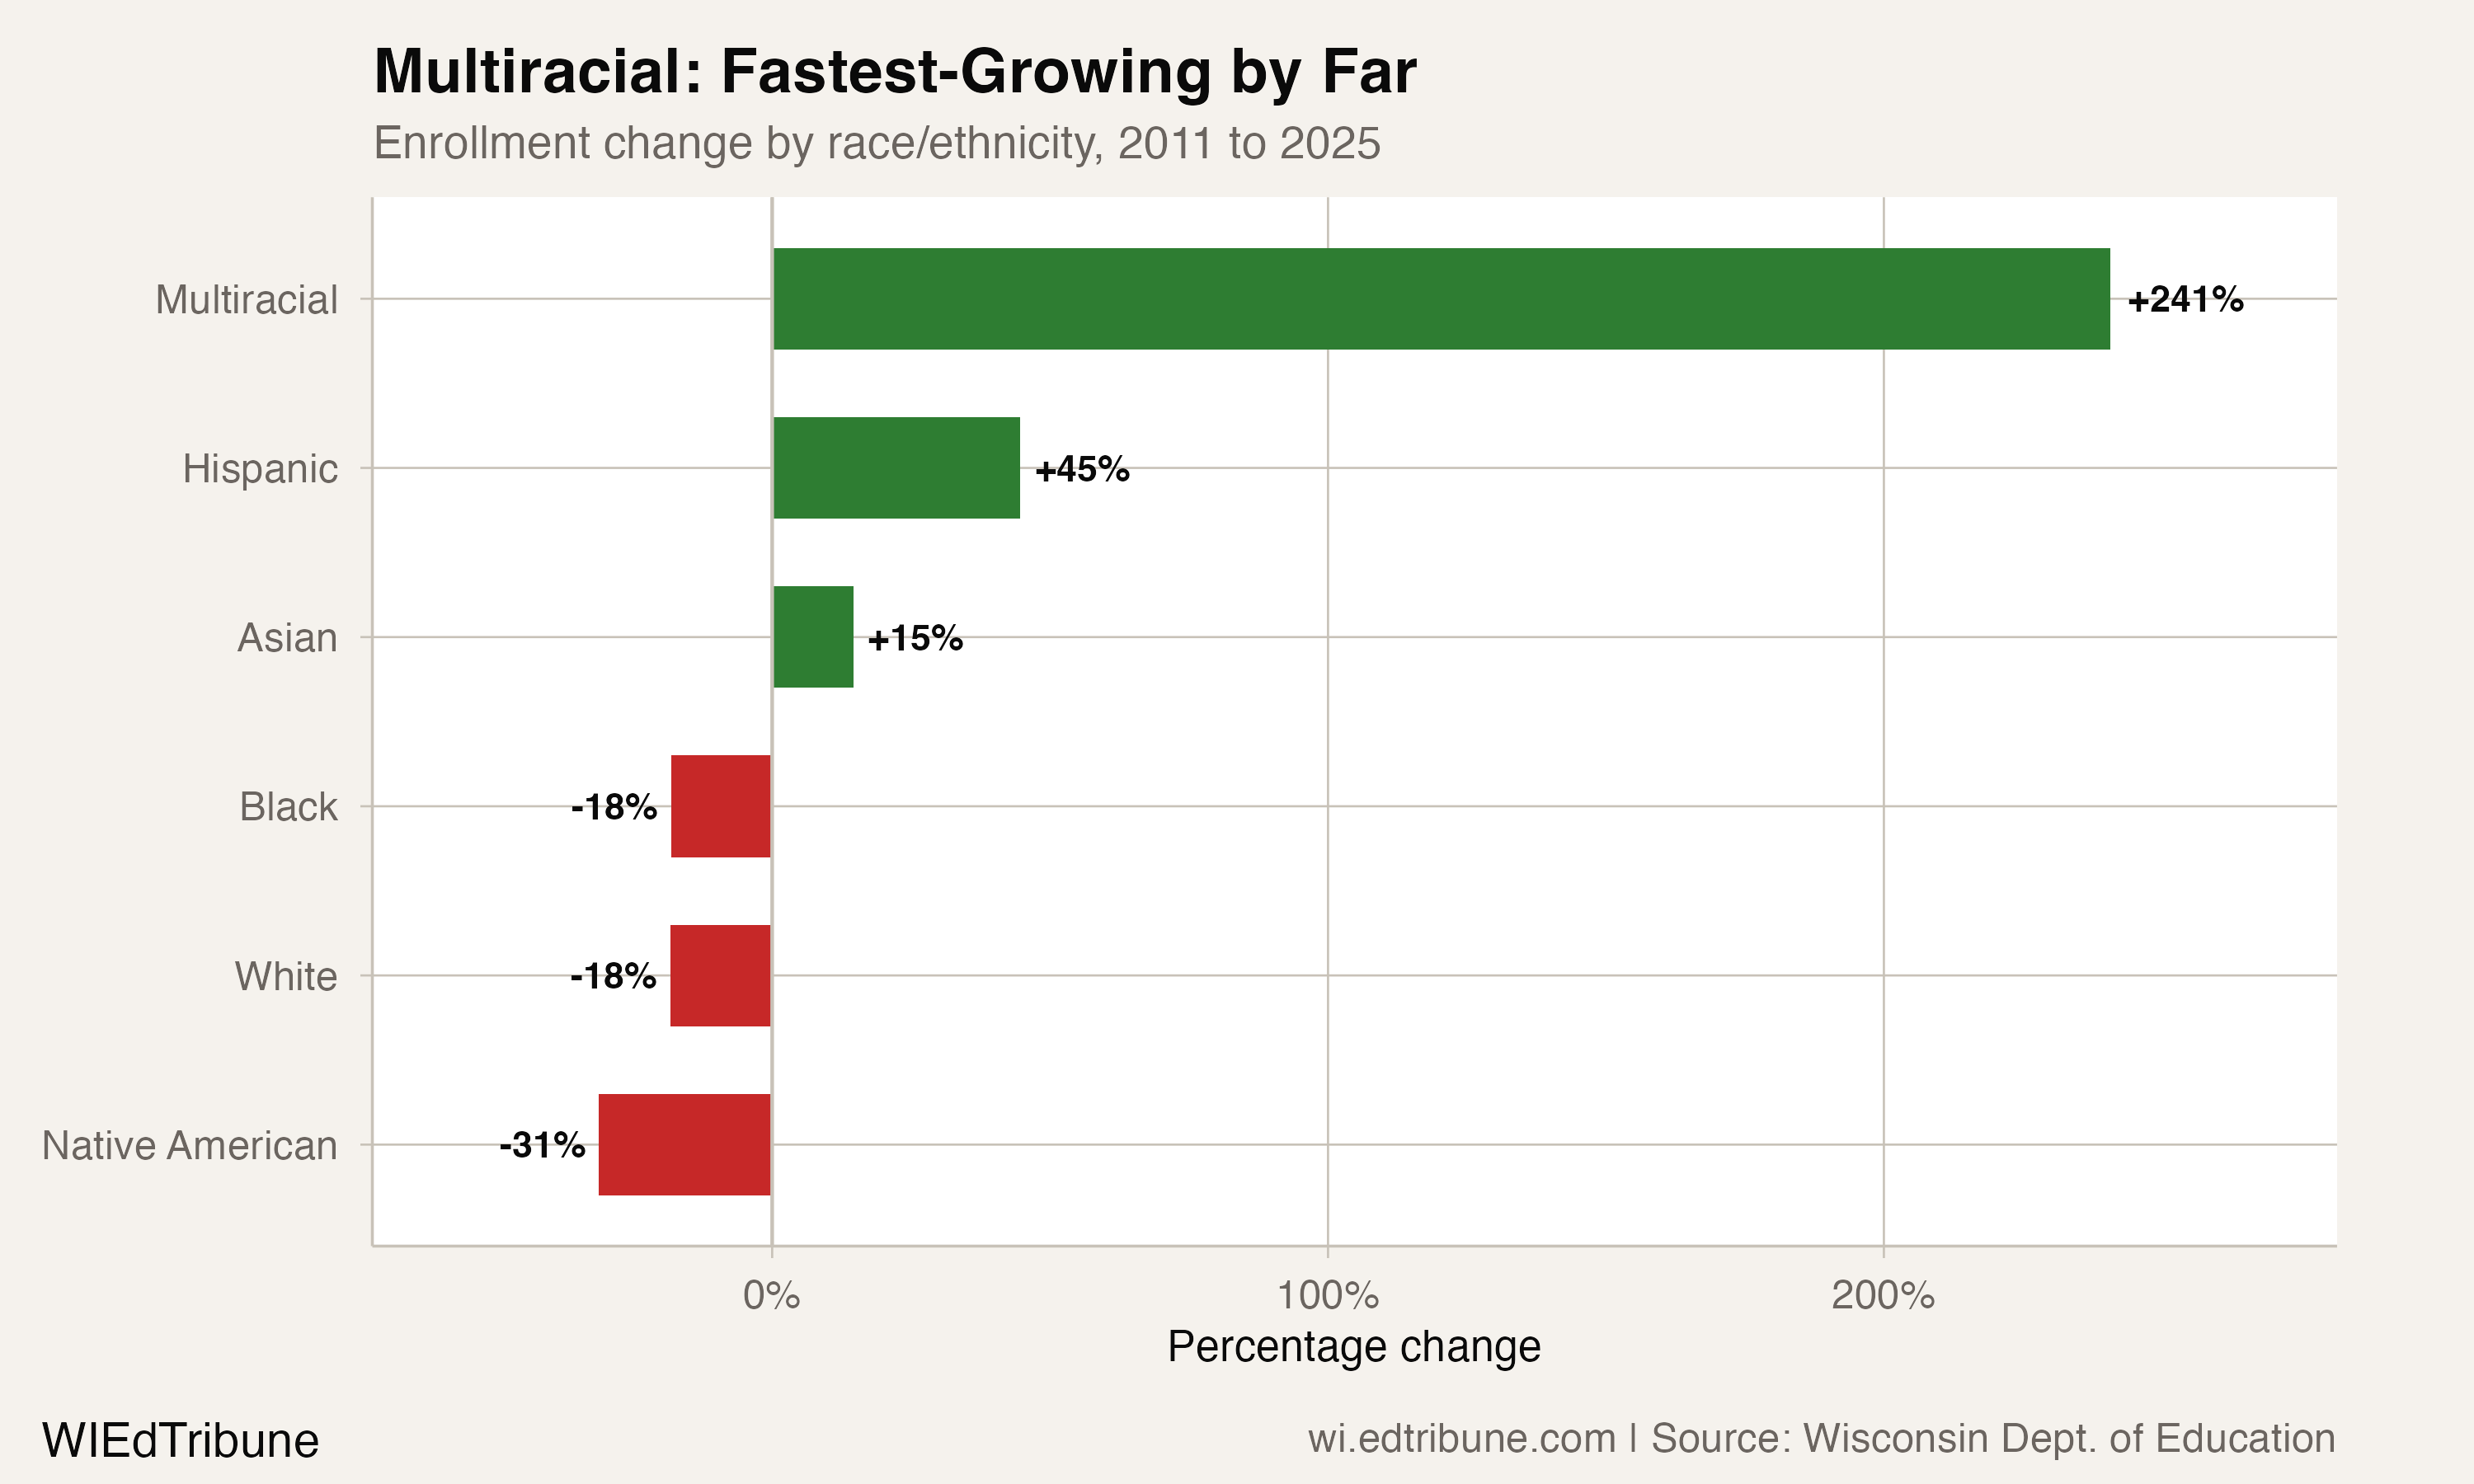
The growth has come while three groups shrank. White enrollment fell 18.3% (-118,723 students), Black enrollment dropped 18.2% (-15,681), and Native American enrollment declined 31.1% (-3,615). Hispanic students grew 44.6% (+36,037). The multiracial category's 240.7% increase is in a class by itself. Notably, multiracial students first exceeded Native American enrollment in their very first year of reporting, 2011.
The reclassification question
The scale of multiracial growth raises a methodological question that has generated substantial academic debate. Princeton sociologists Paul Starr and Christina Pao argued in Sociological Science that the Census Bureau's reported multiracial population boom was largely a statistical artifact: changes in how the Bureau processed race and ethnicity responses, not genuine demographic shifts, drove much of the increase. Their core finding: "origins and identity are not the same," and the Census algorithm conflated the two.
The school enrollment context is different from the decennial census. Wisconsin's DPI collects race and ethnicity through a two-part question format aligned with federal OMB standards since 2010-11. Parents or guardians select the categories, and a student identified with two or more races is reported in the "Two or More Races" group regardless of which specific races are selected. There is no algorithmic recoding of write-in responses, as there was in the census controversy.
Two mechanisms likely contribute, and the data cannot distinguish between them.
The first is demographic. Interracial unions have been rising steadily. Pew Research Center found that the share of newlyweds who married someone of a different race or ethnicity rose from 3% in 1967 to 17% by 2015. The Midwest had the lowest regional intermarriage rate at 11%, but Wisconsin's Hmong, Hispanic, and Black populations concentrated in Milwaukee, Green Bay, and Racine create conditions for interracial family formation above the regional average.
The second is cultural. As multiracial identity becomes more visible, families who might previously have selected a single race for their child are choosing "two or more." This is a reclassification, not a new student, but it is a real change in how families understand and express their children's identity. The two are not mutually exclusive: some of the growth is new multiracial children entering school, and some is existing students reclassified. Wisconsin's 153% growth rate, double the national average, suggests real demographic forces are at work alongside any reclassification effect.
A decelerating climb
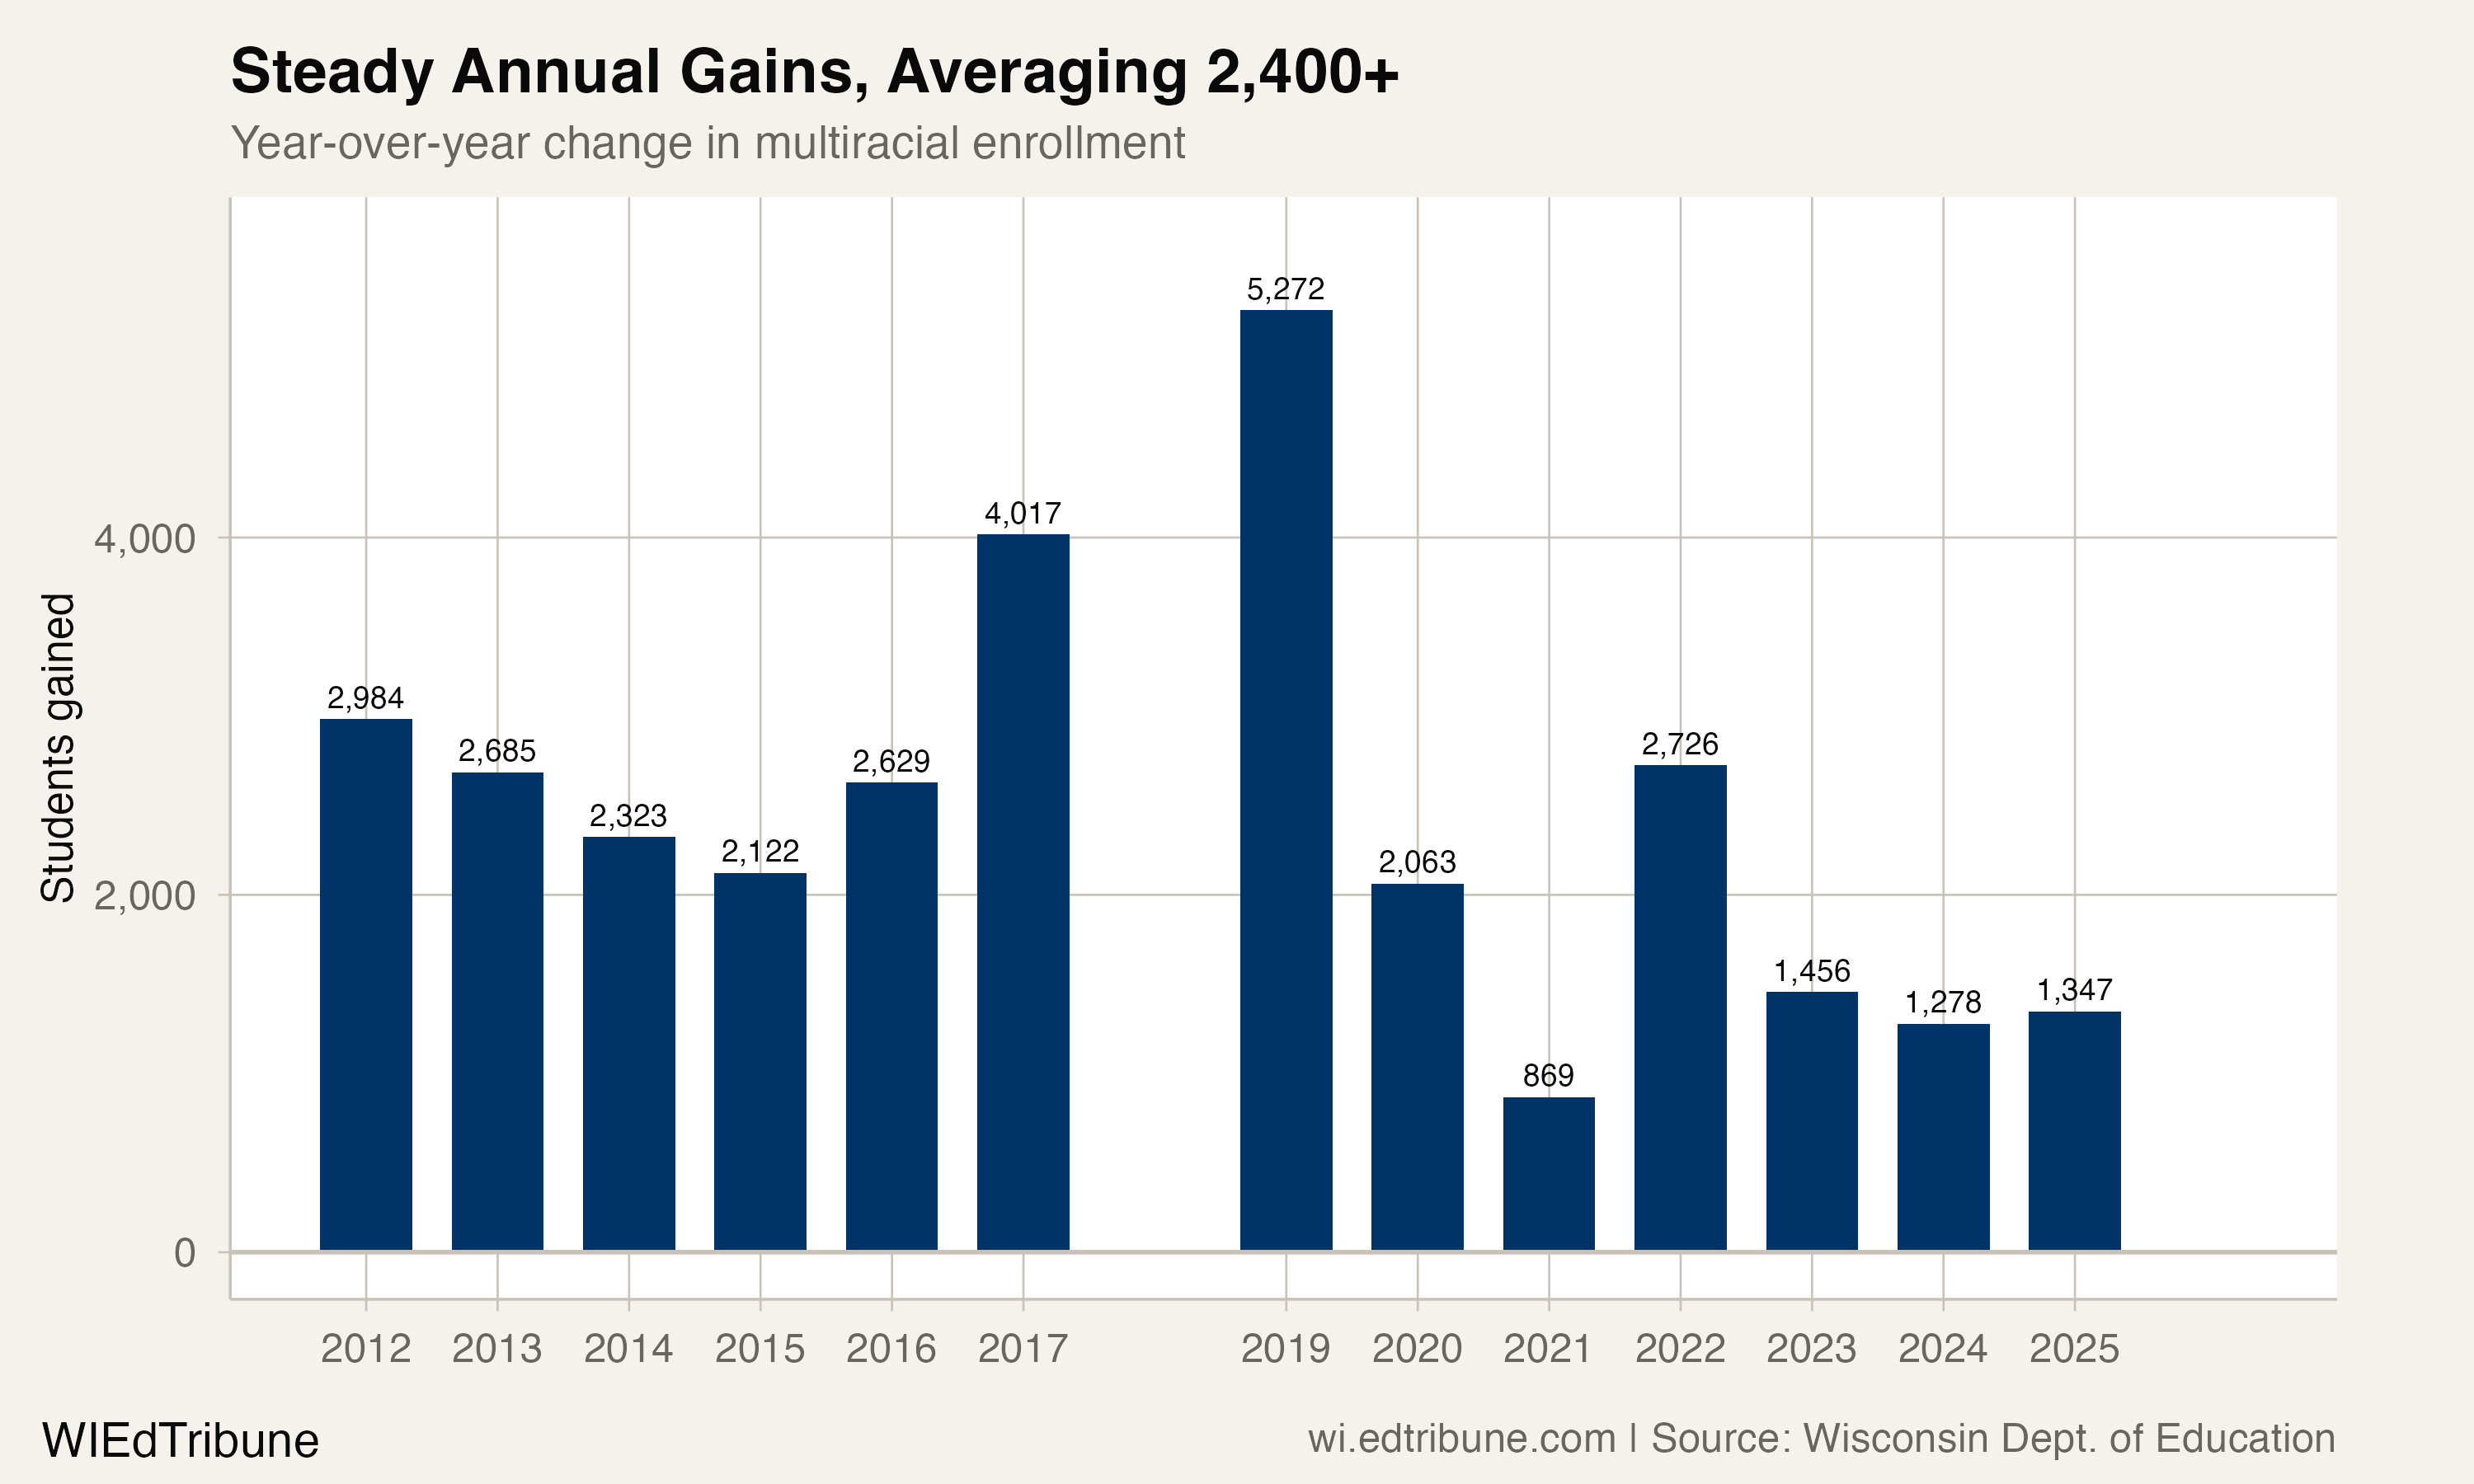
The growth rate has slowed considerably. Between 2011 and 2017, Wisconsin added an average of 2,793 multiracial students per year. From 2019 to 2025, that pace dropped to 1,623 per year. The largest single-year gain was 5,272 in 2019, likely reflecting the catch-up effect of the missing 2018 data year (Wisconsin DPI's server returned errors for the 2017-18 file). The most recent three years have been the smallest gains on record: 1,456 in 2023, 1,278 in 2024, and 1,347 in 2025.
The deceleration does not mean the category is approaching saturation. At 5.6% of enrollment, multiracial students remain a small share of the total. The 2020 Census found that nearly a third of Americans reporting two or more races were under 18, suggesting the school-age population has substantial room to grow. What the slowing pace more likely reflects is that the initial wave of reclassification has passed, and growth is now driven primarily by new cohorts entering kindergarten.
Where multiracial students are concentrated
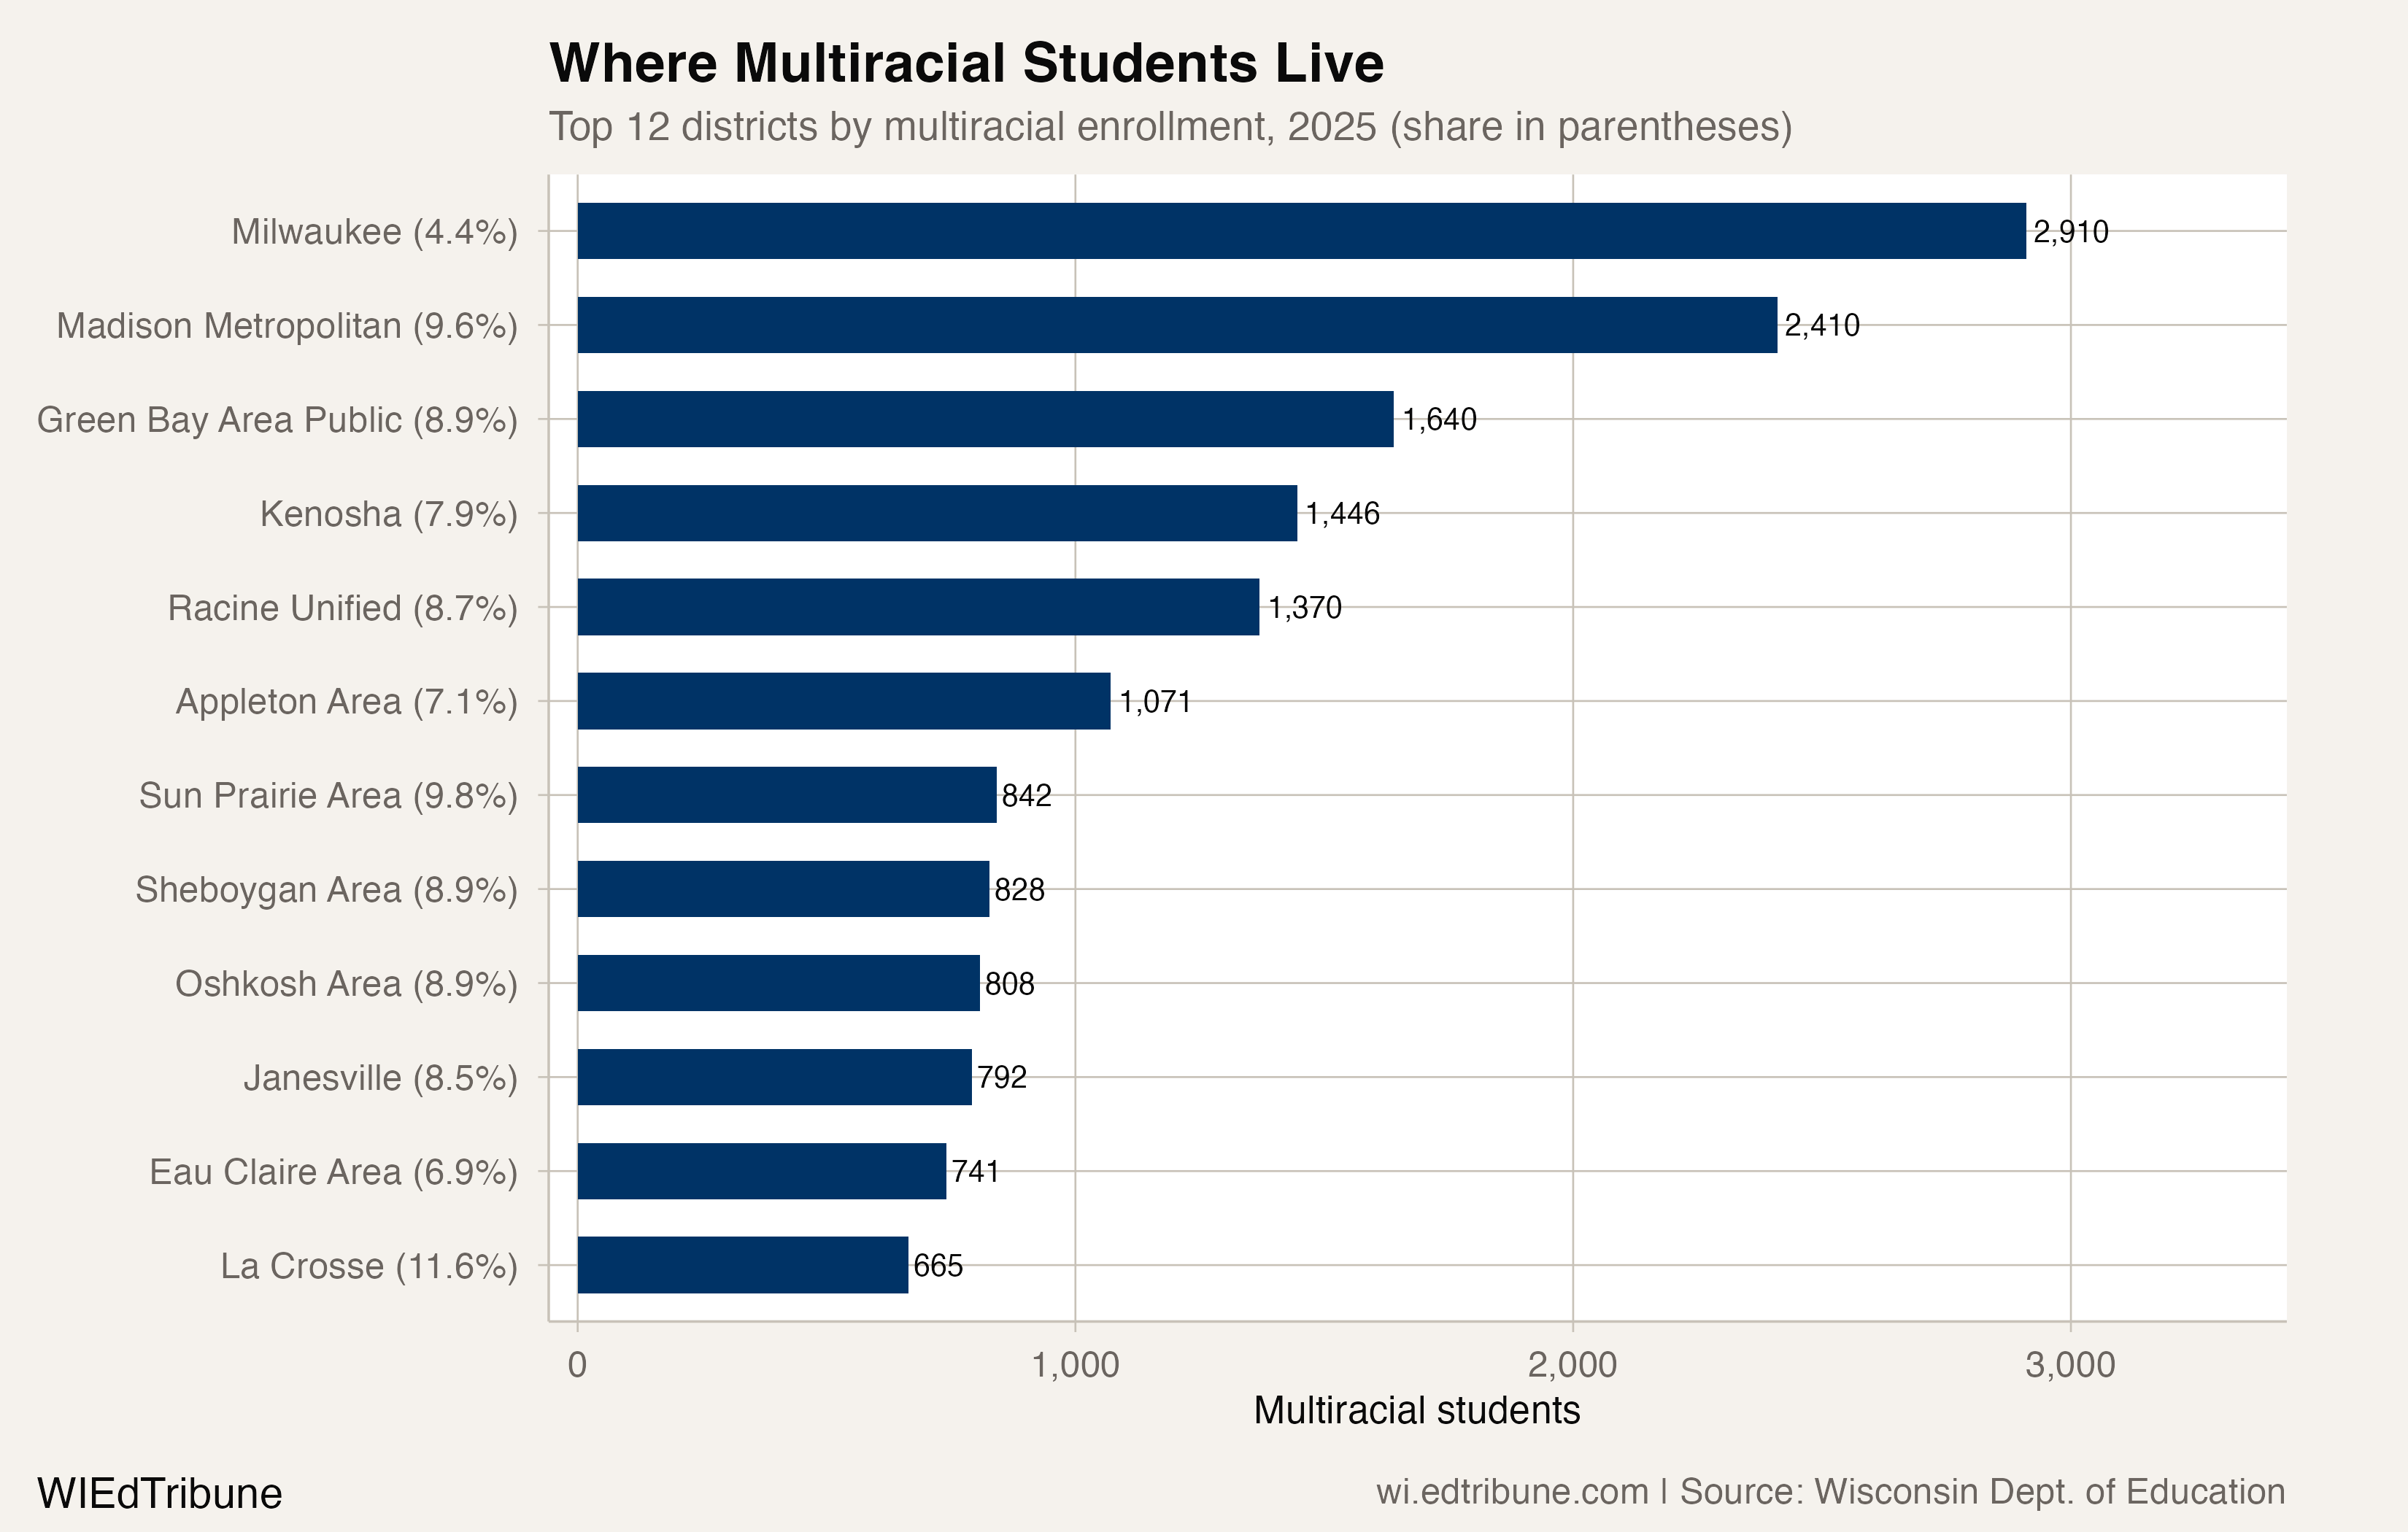
Milwaukee↗ET has the most multiracial students in absolute terms, with 2,910, but its 4.4% share is below the state average. That share is also striking for another reason: in 2011, Milwaukee reported just 71 multiracial students. The 3,999% increase suggests the district underwent a major reclassification event at some point during this period, likely as families and school registrars became more familiar with the two-or-more-races option.
Madison Metropolitan↗ET ranks second with 2,410 multiracial students and a 9.6% share. Green Bay↗ET follows with 1,640 (8.9%), Kenosha↗ET with 1,446 (7.9%), and Racine↗ET with 1,370 (8.7%). The highest share among districts with at least 200 total students belongs to Gresham↗ET, a small Shawano County district where 22.0% of students identify as multiracial, reflecting the intersection of the Menominee and Stockbridge-Munsee tribal communities with non-Native populations.
La Crosse↗ET stands out among mid-sized districts with an 11.6% multiracial share, the highest of any district with more than 5,000 students. Nearby Shawano↗ET (14.0%), Crandon↗ET (14.0%), and Webster↗ET (15.2%) all sit in areas where Native American, white, and other communities overlap geographically.
What the trend line obscures
The multiracial category is the only racial group in Wisconsin that has never declined. Every other group, including Hispanic, has had at least one year of negative year-over-year change. Multiracial enrollment grew even in the COVID year of 2021, when it added 869 students while statewide enrollment cratered.
That resilience is partly structural. The category is still young enough that each new kindergarten cohort entering the system carries more multiracial students than the graduating cohort it replaces. It is also partly cultural: the direction of identity selection appears to be one-way. Families that begin identifying children as multiracial rarely switch back to a single-race category.
The practical consequence for schools is modest but growing. Multiracial students do not constitute a service population in the way that English learners or students with disabilities do. They do not generate additional per-pupil funding or trigger specialized programming. But they do reshape how districts understand their demographics, and how those demographics map onto achievement, discipline, and participation data. A district that was 80% white and 10% Black a decade ago may now be 70% white, 8% Black, and 10% multiracial. The total non-white share grew, but the change came from a group that cuts across every racial category rather than from any single one.
Wisconsin's multiracial enrollment will almost certainly continue to grow, though at a slower pace than the explosive early years. NCES projects the national share will reach 6% by 2031. Wisconsin, already at 5.6%, is ahead of that curve. The more interesting question is whether multiracial growth will eventually slow Black and Native American enrollment declines as families that once selected those categories begin selecting two or more races instead, or whether it will accelerate the decline of the white majority share. In a state where white students dropped from 74.4% to 65.8% in 14 years, the fastest-growing group is one that cannot be neatly placed on either side of that divide.
Detailed code that reproduces the analysis and figures in this article is available exclusively to EdTribune subscribers.
Discussion
Sign in to join the discussion.
Loading comments...