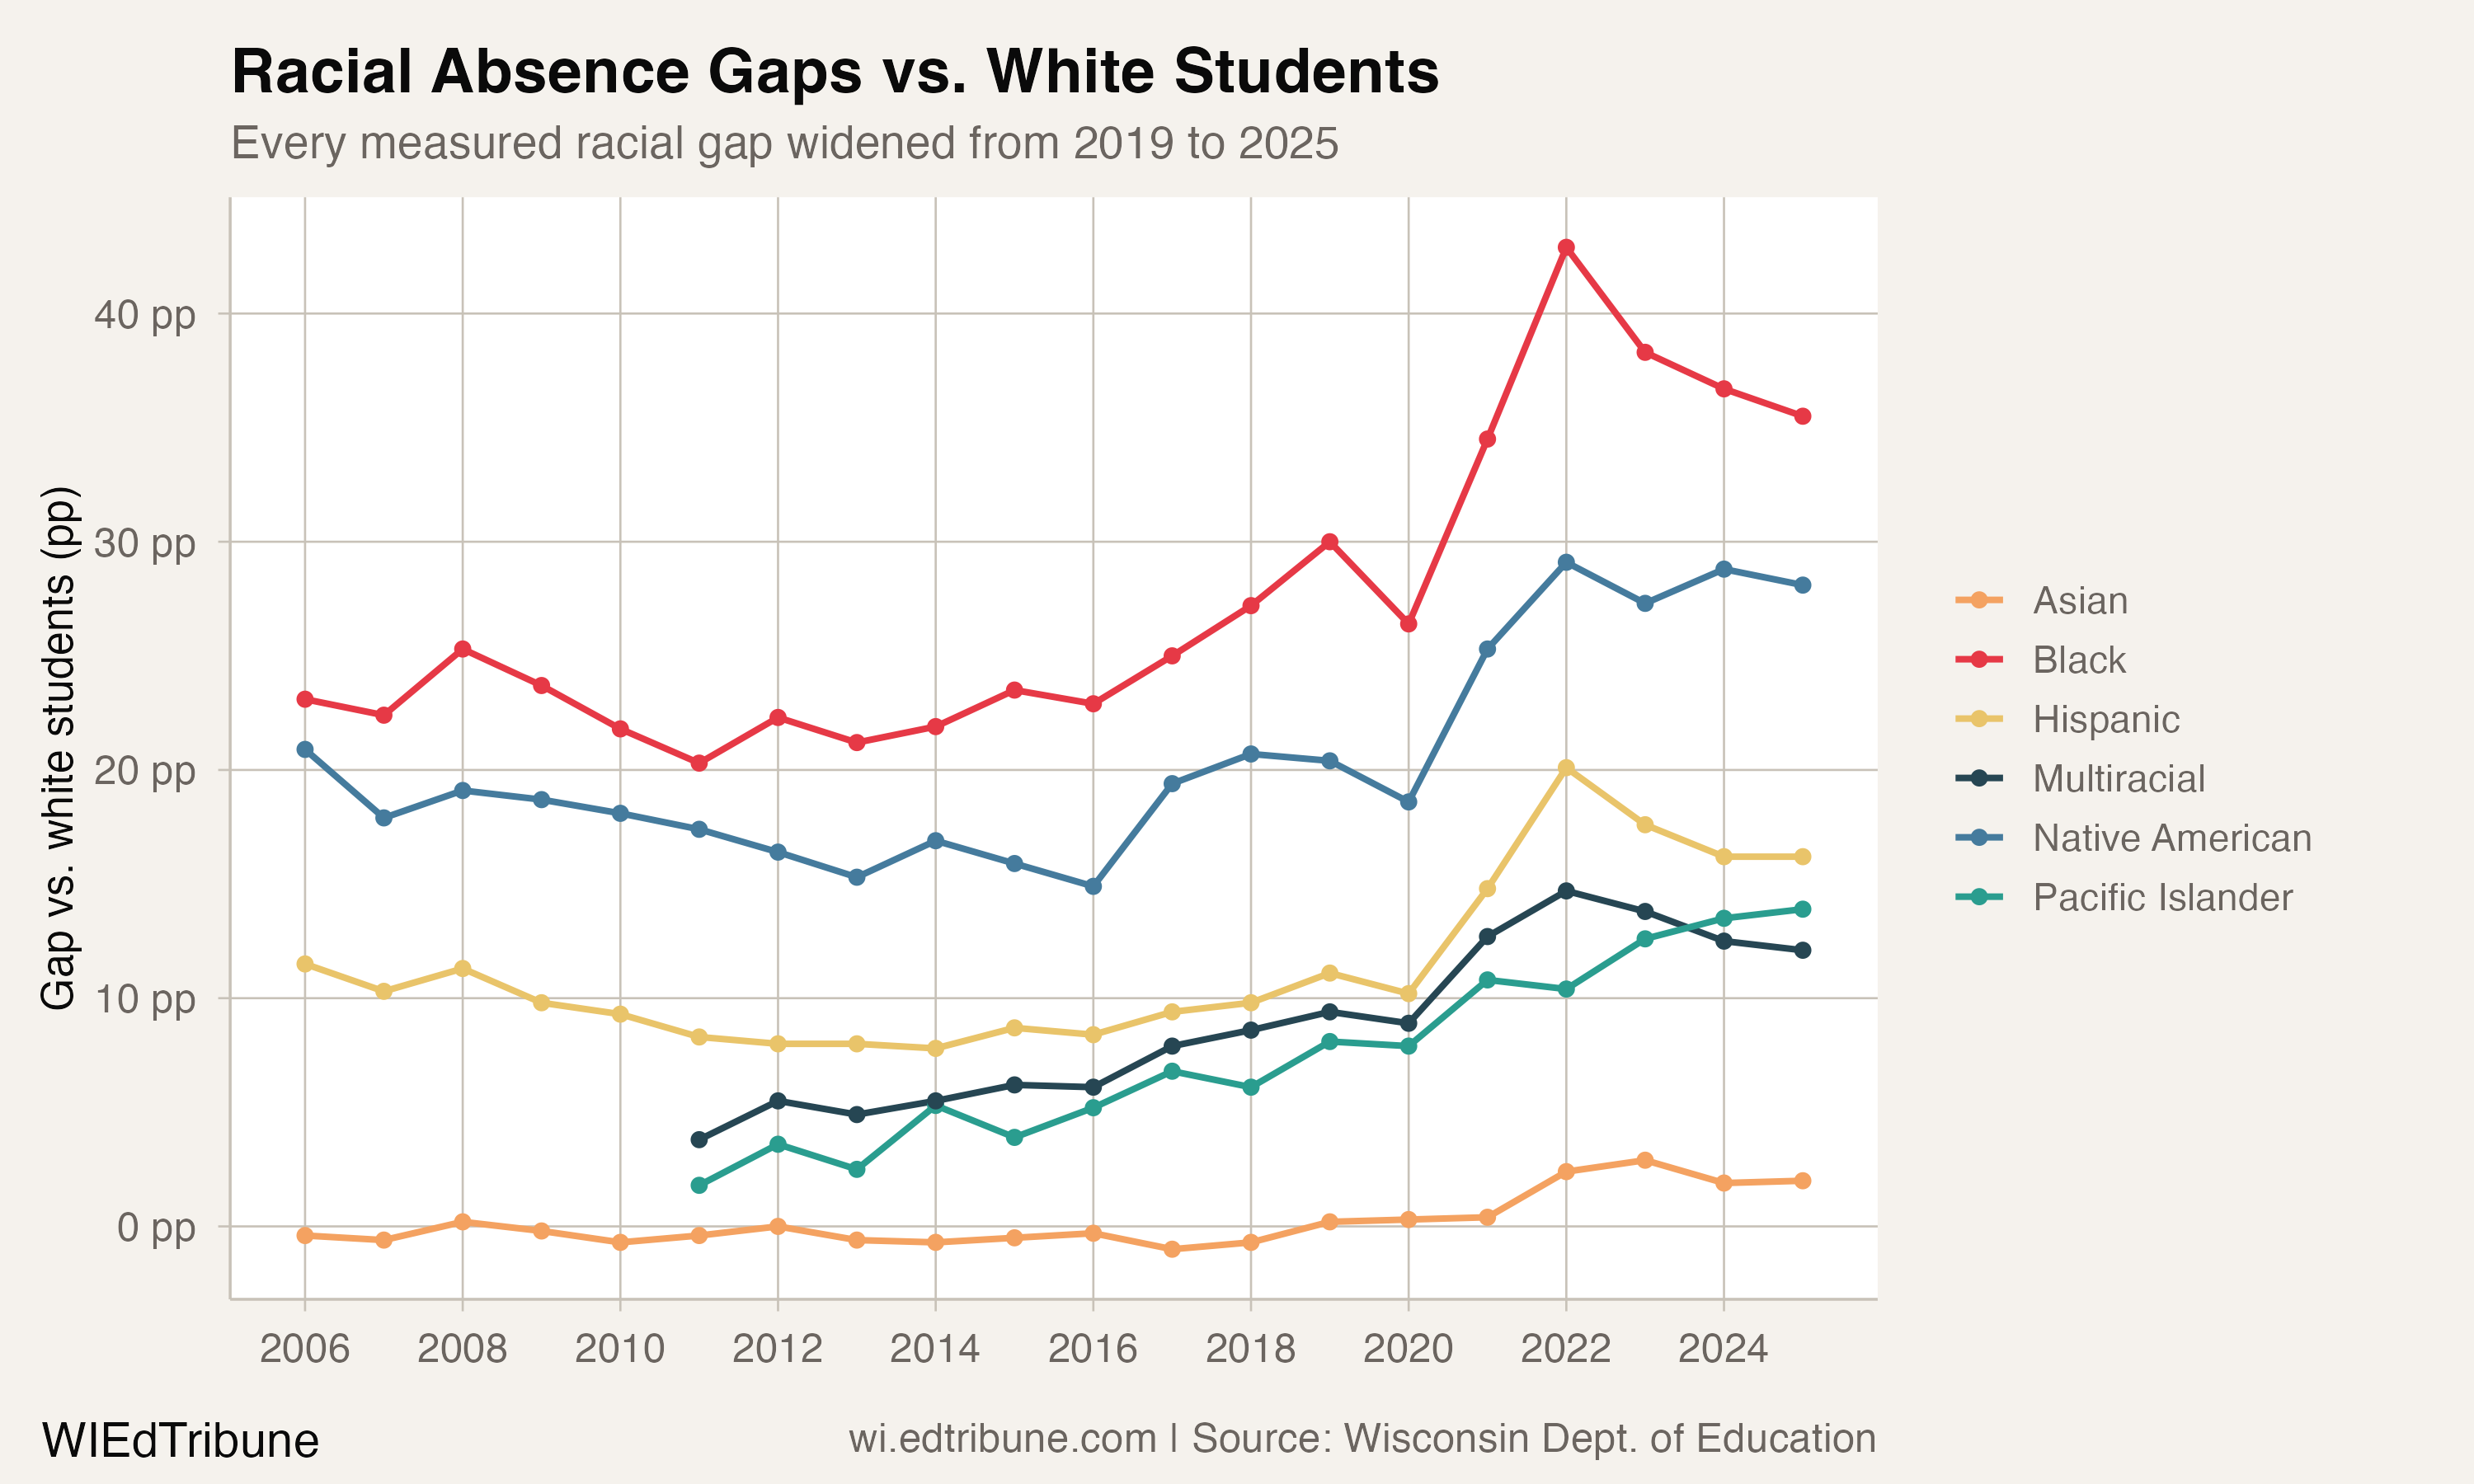
Wisconsin's chronic absenteeism data contains a finding that is stark because it is universal. Between 2019 and 2025, every racial gap measured against white students widened. Not most of them. Not just the largest ones. Every one.
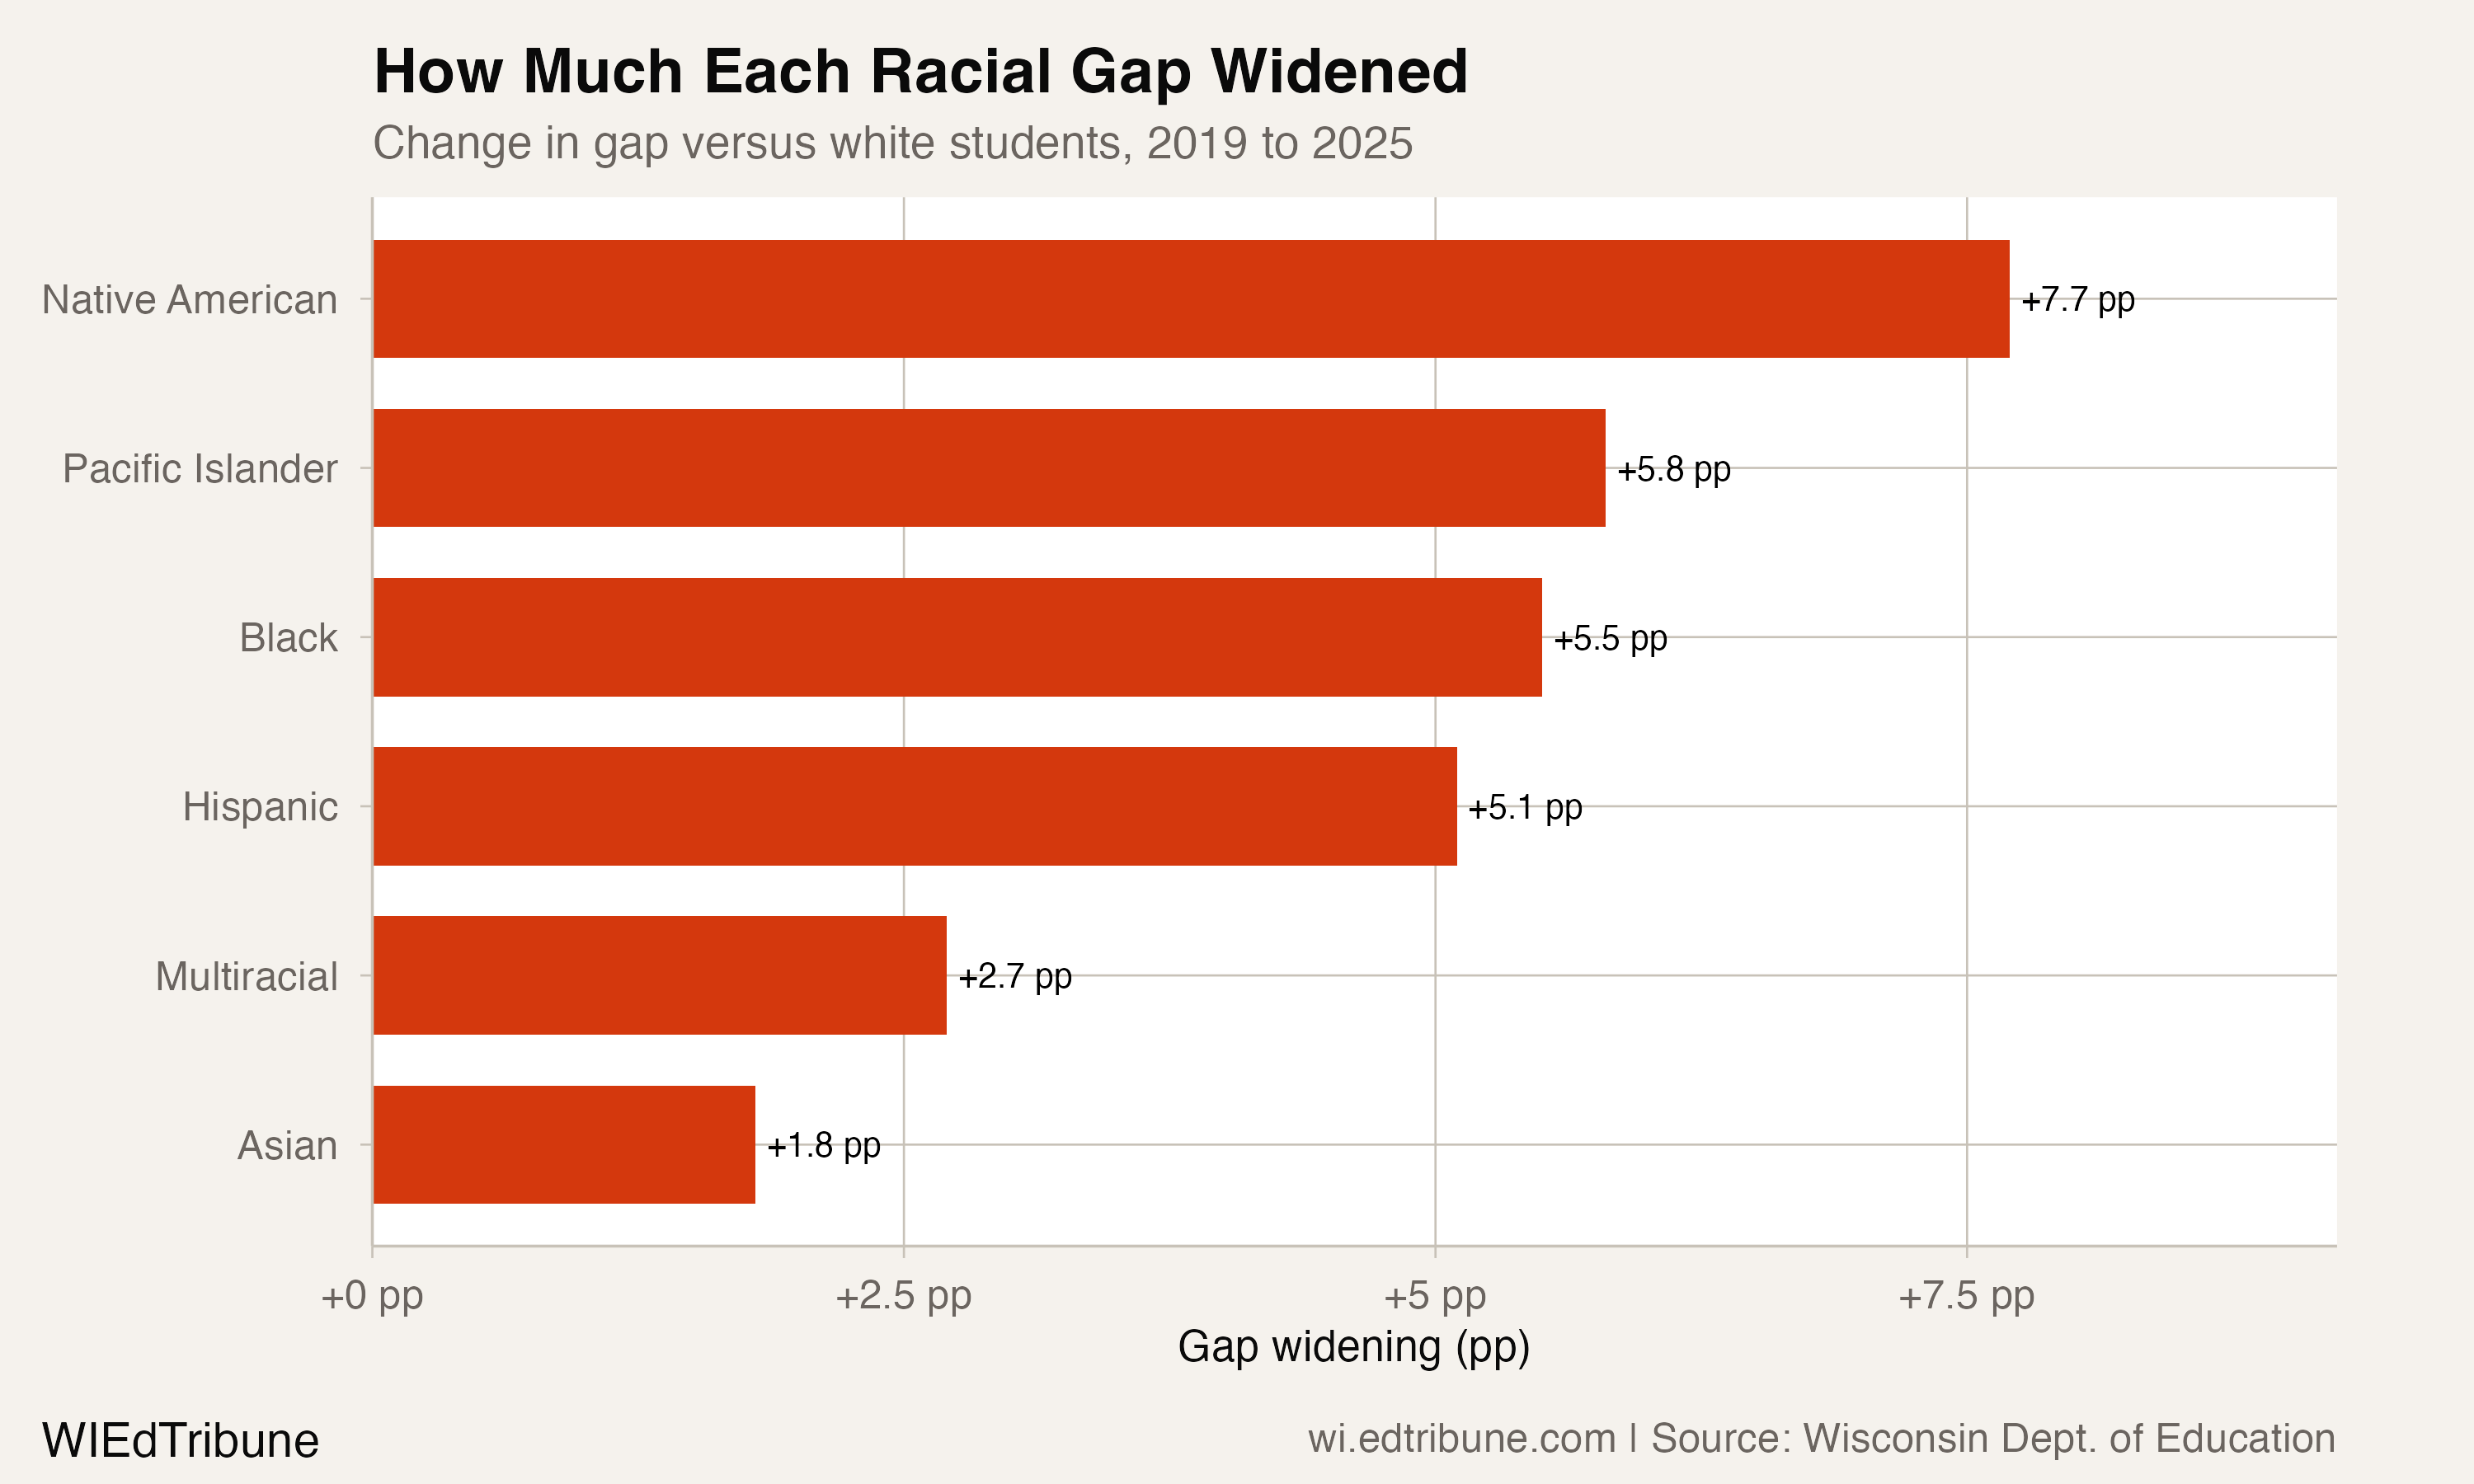
- Native American-white gap: +7.7 percentage points
- Pacific Islander-white gap: +5.8 pp
- Black-white gap: +5.5 pp
- Hispanic-white gap: +5.1 pp
- Multiracial-white gap: +2.7 pp
- Asian-white gap: +1.8 pp
Six gaps measured. Six gaps wider. Zero narrowed.
The Baseline Did Not Fully Recover
White students are used as the comparison group not because their rate is ideal. Their 2025 chronic absenteeism rate was 10.8%, still 2.6 points above the 2019 rate of 8.2%. The point is comparative: every other measured racial group remained further above its 2019 rate in 2025.
That is why the gaps widened even though white students had not returned to their pre-COVID level. Black students were 8.1 points above their 2019 rate in 2025. Native American students were 10.3 points above. Pacific Islander students were 8.4 points above, Hispanic students 7.7, multiracial students 5.3 and Asian students 4.4.
The Rates Behind the Gaps
The abstract language of "gaps" can obscure the scale of the underlying rates. In 2025:
- 46.3% of Black students are chronically absent
- 38.9% of Native American students are chronically absent
- 27.0% of Hispanic students are chronically absent
- 24.7% of Pacific Islander students are chronically absent
- 22.9% of multiracial students are chronically absent
- 12.8% of Asian students are chronically absent
- 10.8% of white students are chronically absent
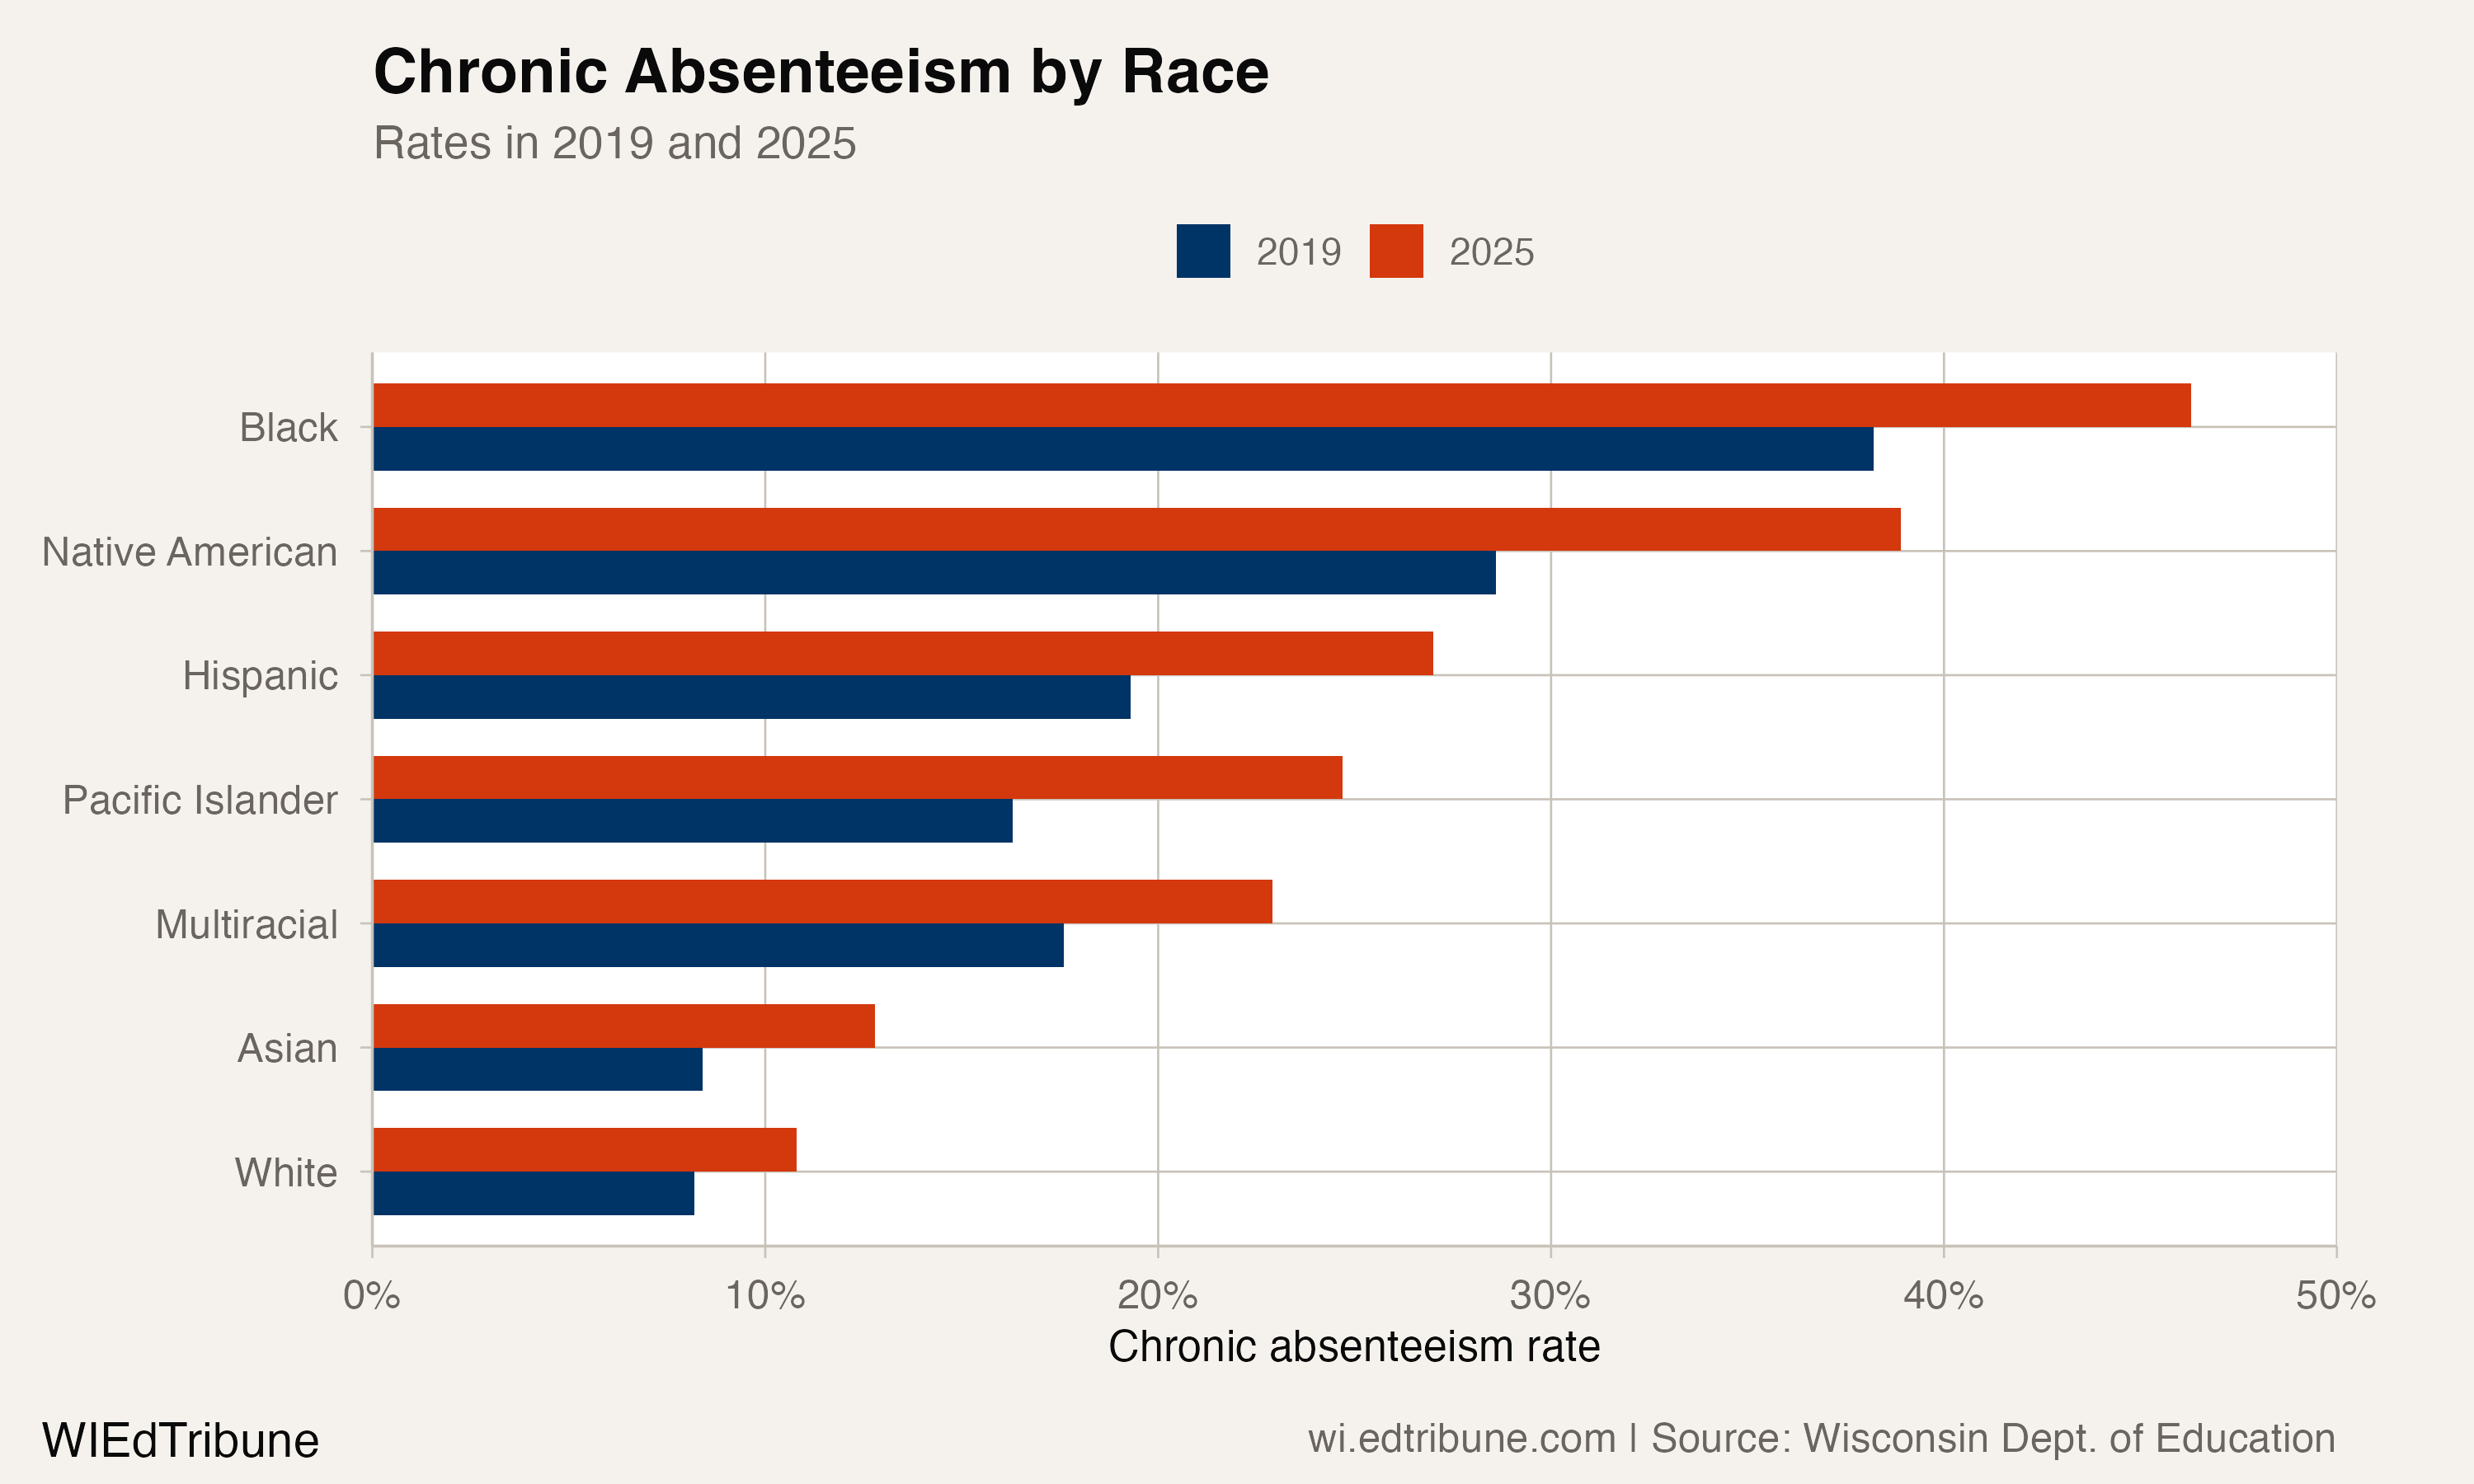
For Black students, the 2025 rate was more than four times the white rate. For Native American students, it was more than three and a half times the white rate.
Wisconsin's current accountability definition treats chronic absenteeism as a student-level measure based on possible attendance days, not a schoolwide average attendance rate, according to the Wisconsin Department of Public Instruction.
What the Data Can and Cannot Explain
The direct evidence here is the state attendance data: every measured racial gap widened from 2019 to 2025. The data does not prove why. It does, however, put a hard boundary around the outcome of post-pandemic recovery: whatever helped attendance improve after the 2022 peak did not close any of the six racial gaps measured here.
The broader recovery context is suggestive, not causal proof. Wisconsin districts spent more than $2.3 billion in federal pandemic relief funds, and the final ESSER round required at least 20% of aid to address pandemic-related academic decline through evidence-based interventions, according to a Wisconsin Policy Forum review. A CCSSO review of state ESSER attendance work described state investments in early warning systems, reengagement of chronically absent students, family engagement and wraparound supports.
That context matters because it rules out an easy reading of the numbers. The widening does not mean nothing was tried, and it does not show what would have happened without those efforts. It shows that, by 2025, the measured recovery was not equitable enough to bring any racial gap back to its 2019 level.
One Gap Hit a Series High
The strongest superlative in the package is narrower than the original draft implied. A full scan of the 2006-2025 state series shows the Pacific Islander-white gap was the only measured racial gap at its series high in 2025. The other five 2025 gaps were wider than they were in 2019, but below their 2022 or 2023 highs.
That distinction is important. The story is not that every gap is at a record. It is that none of the six measured gaps has returned to its pre-COVID width.
The competing explanation is that different barriers may be moving at the same time. Attendance Works says chronic absence is often tied to health problems and barriers such as transportation, safe routes to school and food insecurity; that is useful context, not direct Wisconsin evidence for any single subgroup. The next question for The WIEdTribune is where the statewide pattern is being driven locally: which districts narrowed a gap despite the statewide trend, and which ones account for the widening.
Detailed code that reproduces the analysis and figures in this article is available exclusively to EdTribune subscribers.
Discussion
Sign in to join the discussion.
Loading comments...