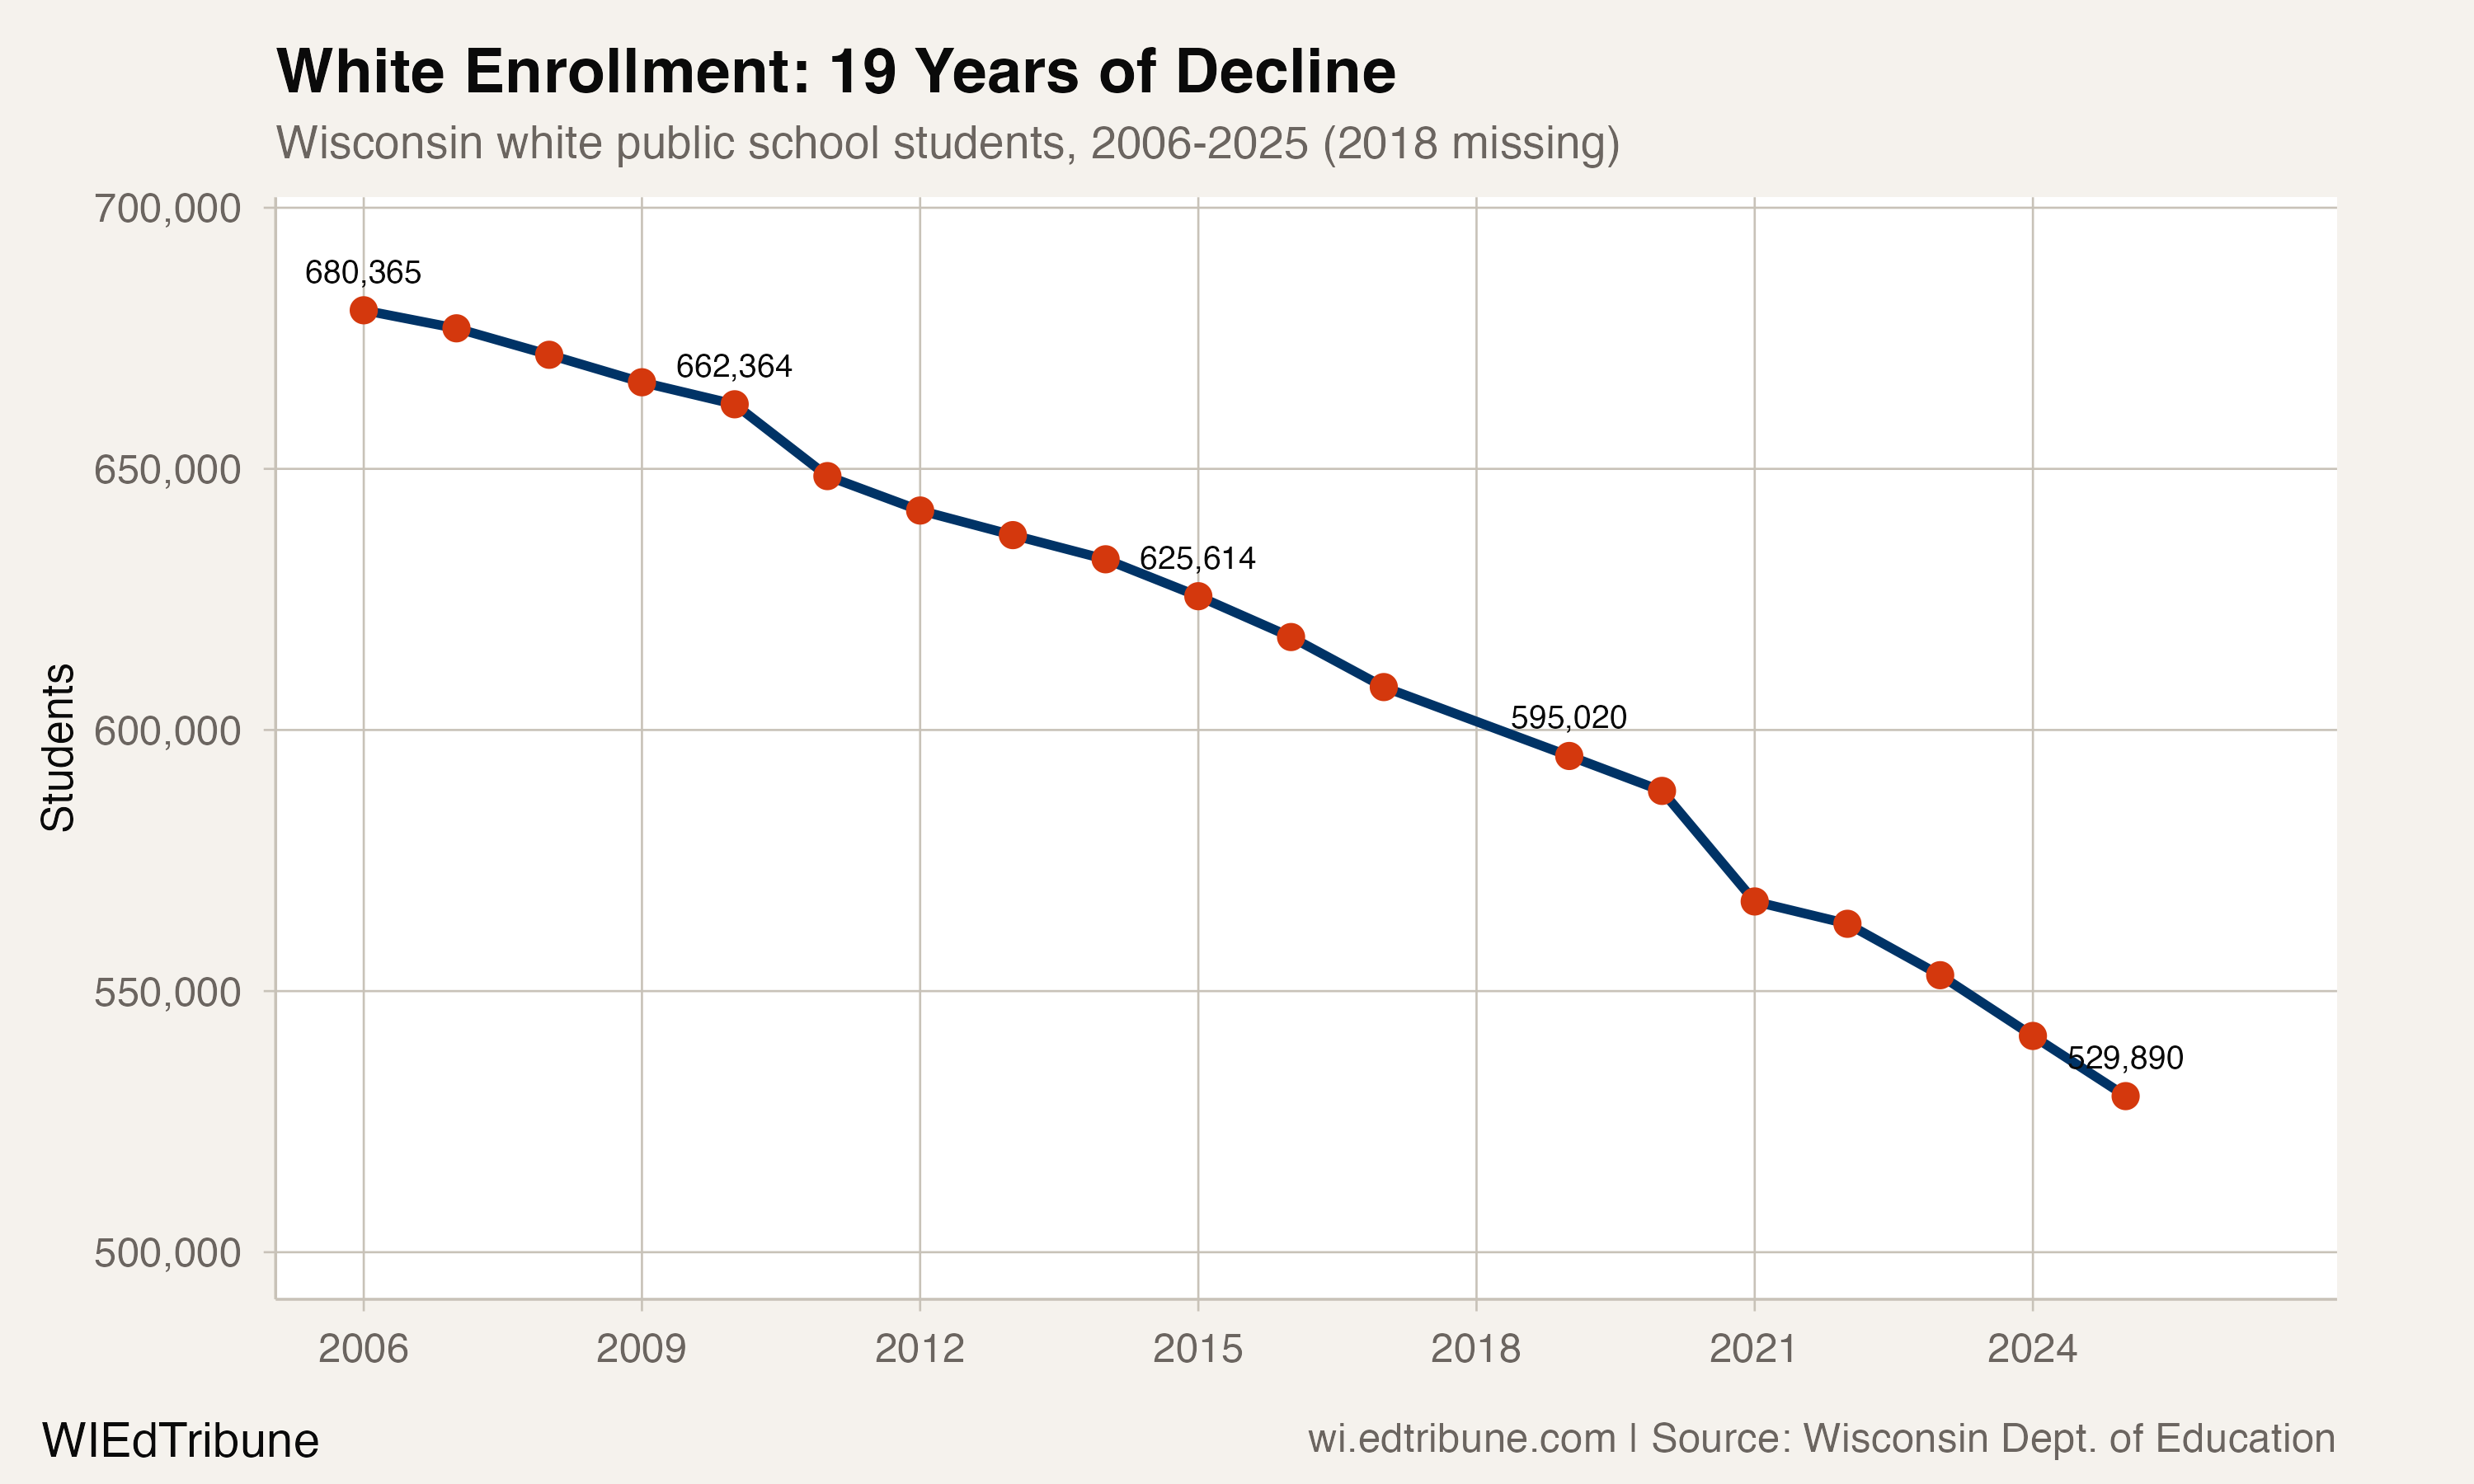
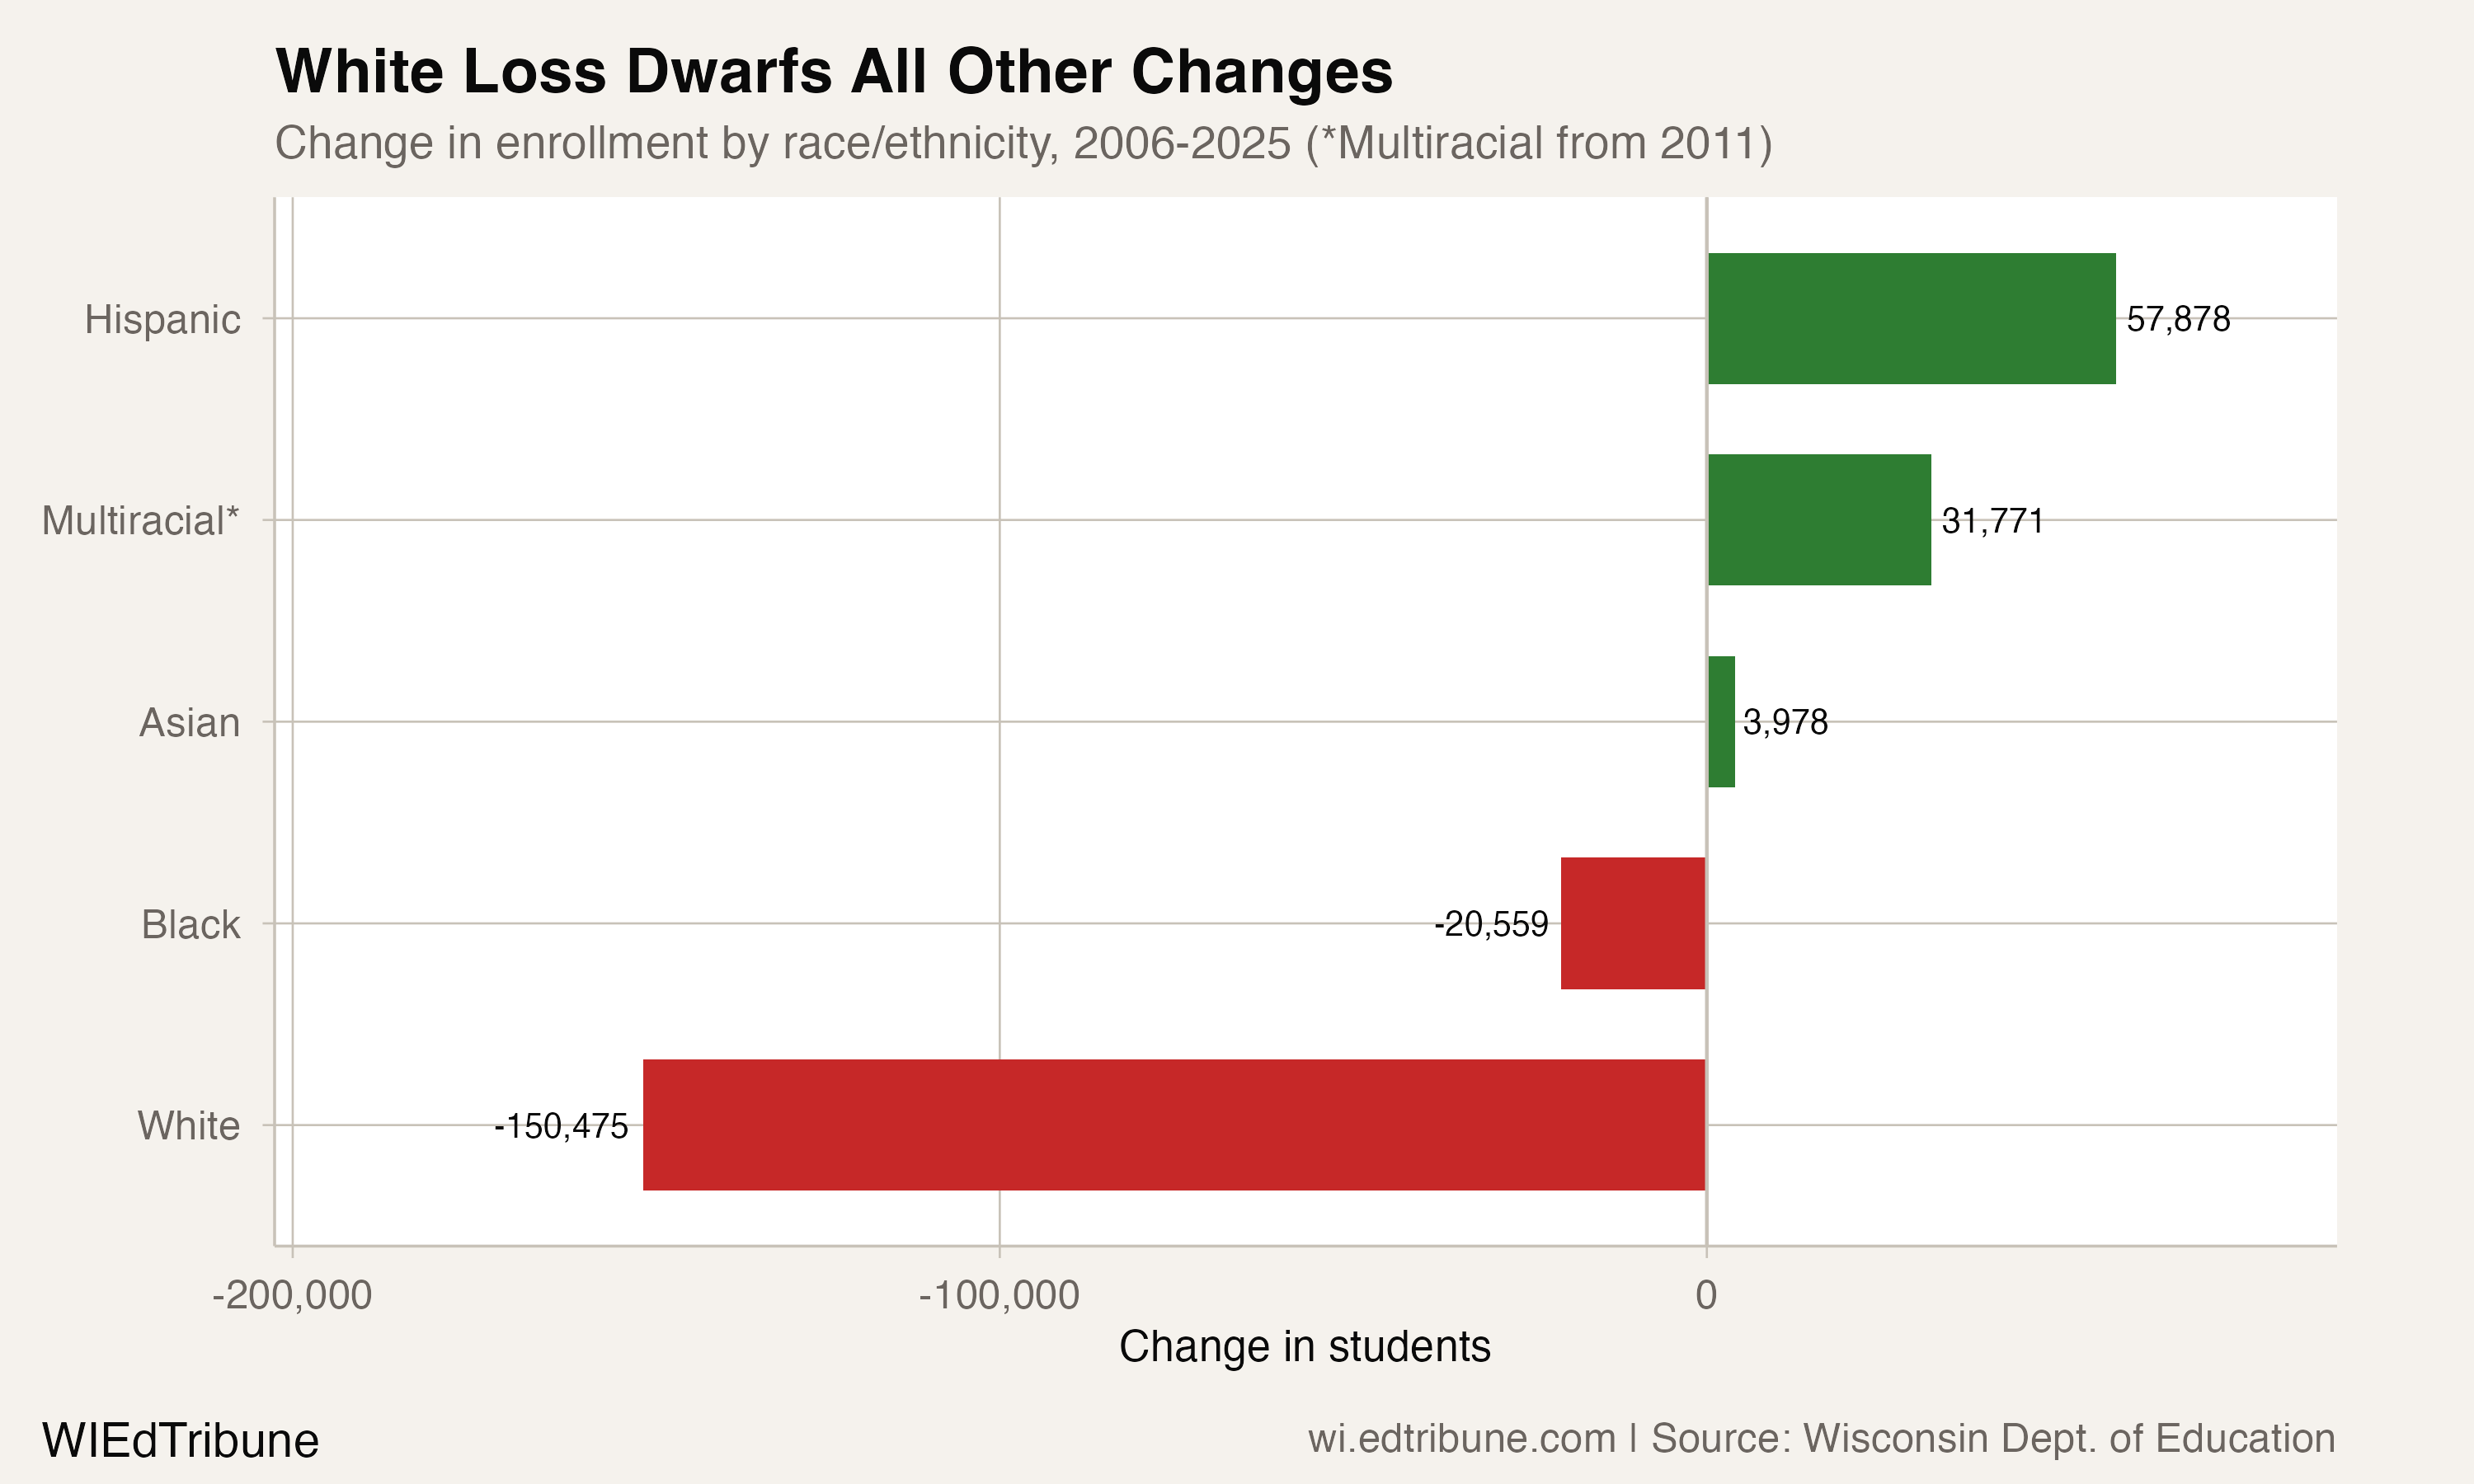
Wisconsin lost 67,640 public school students between 2006 and 2025. White students alone lost 150,475.
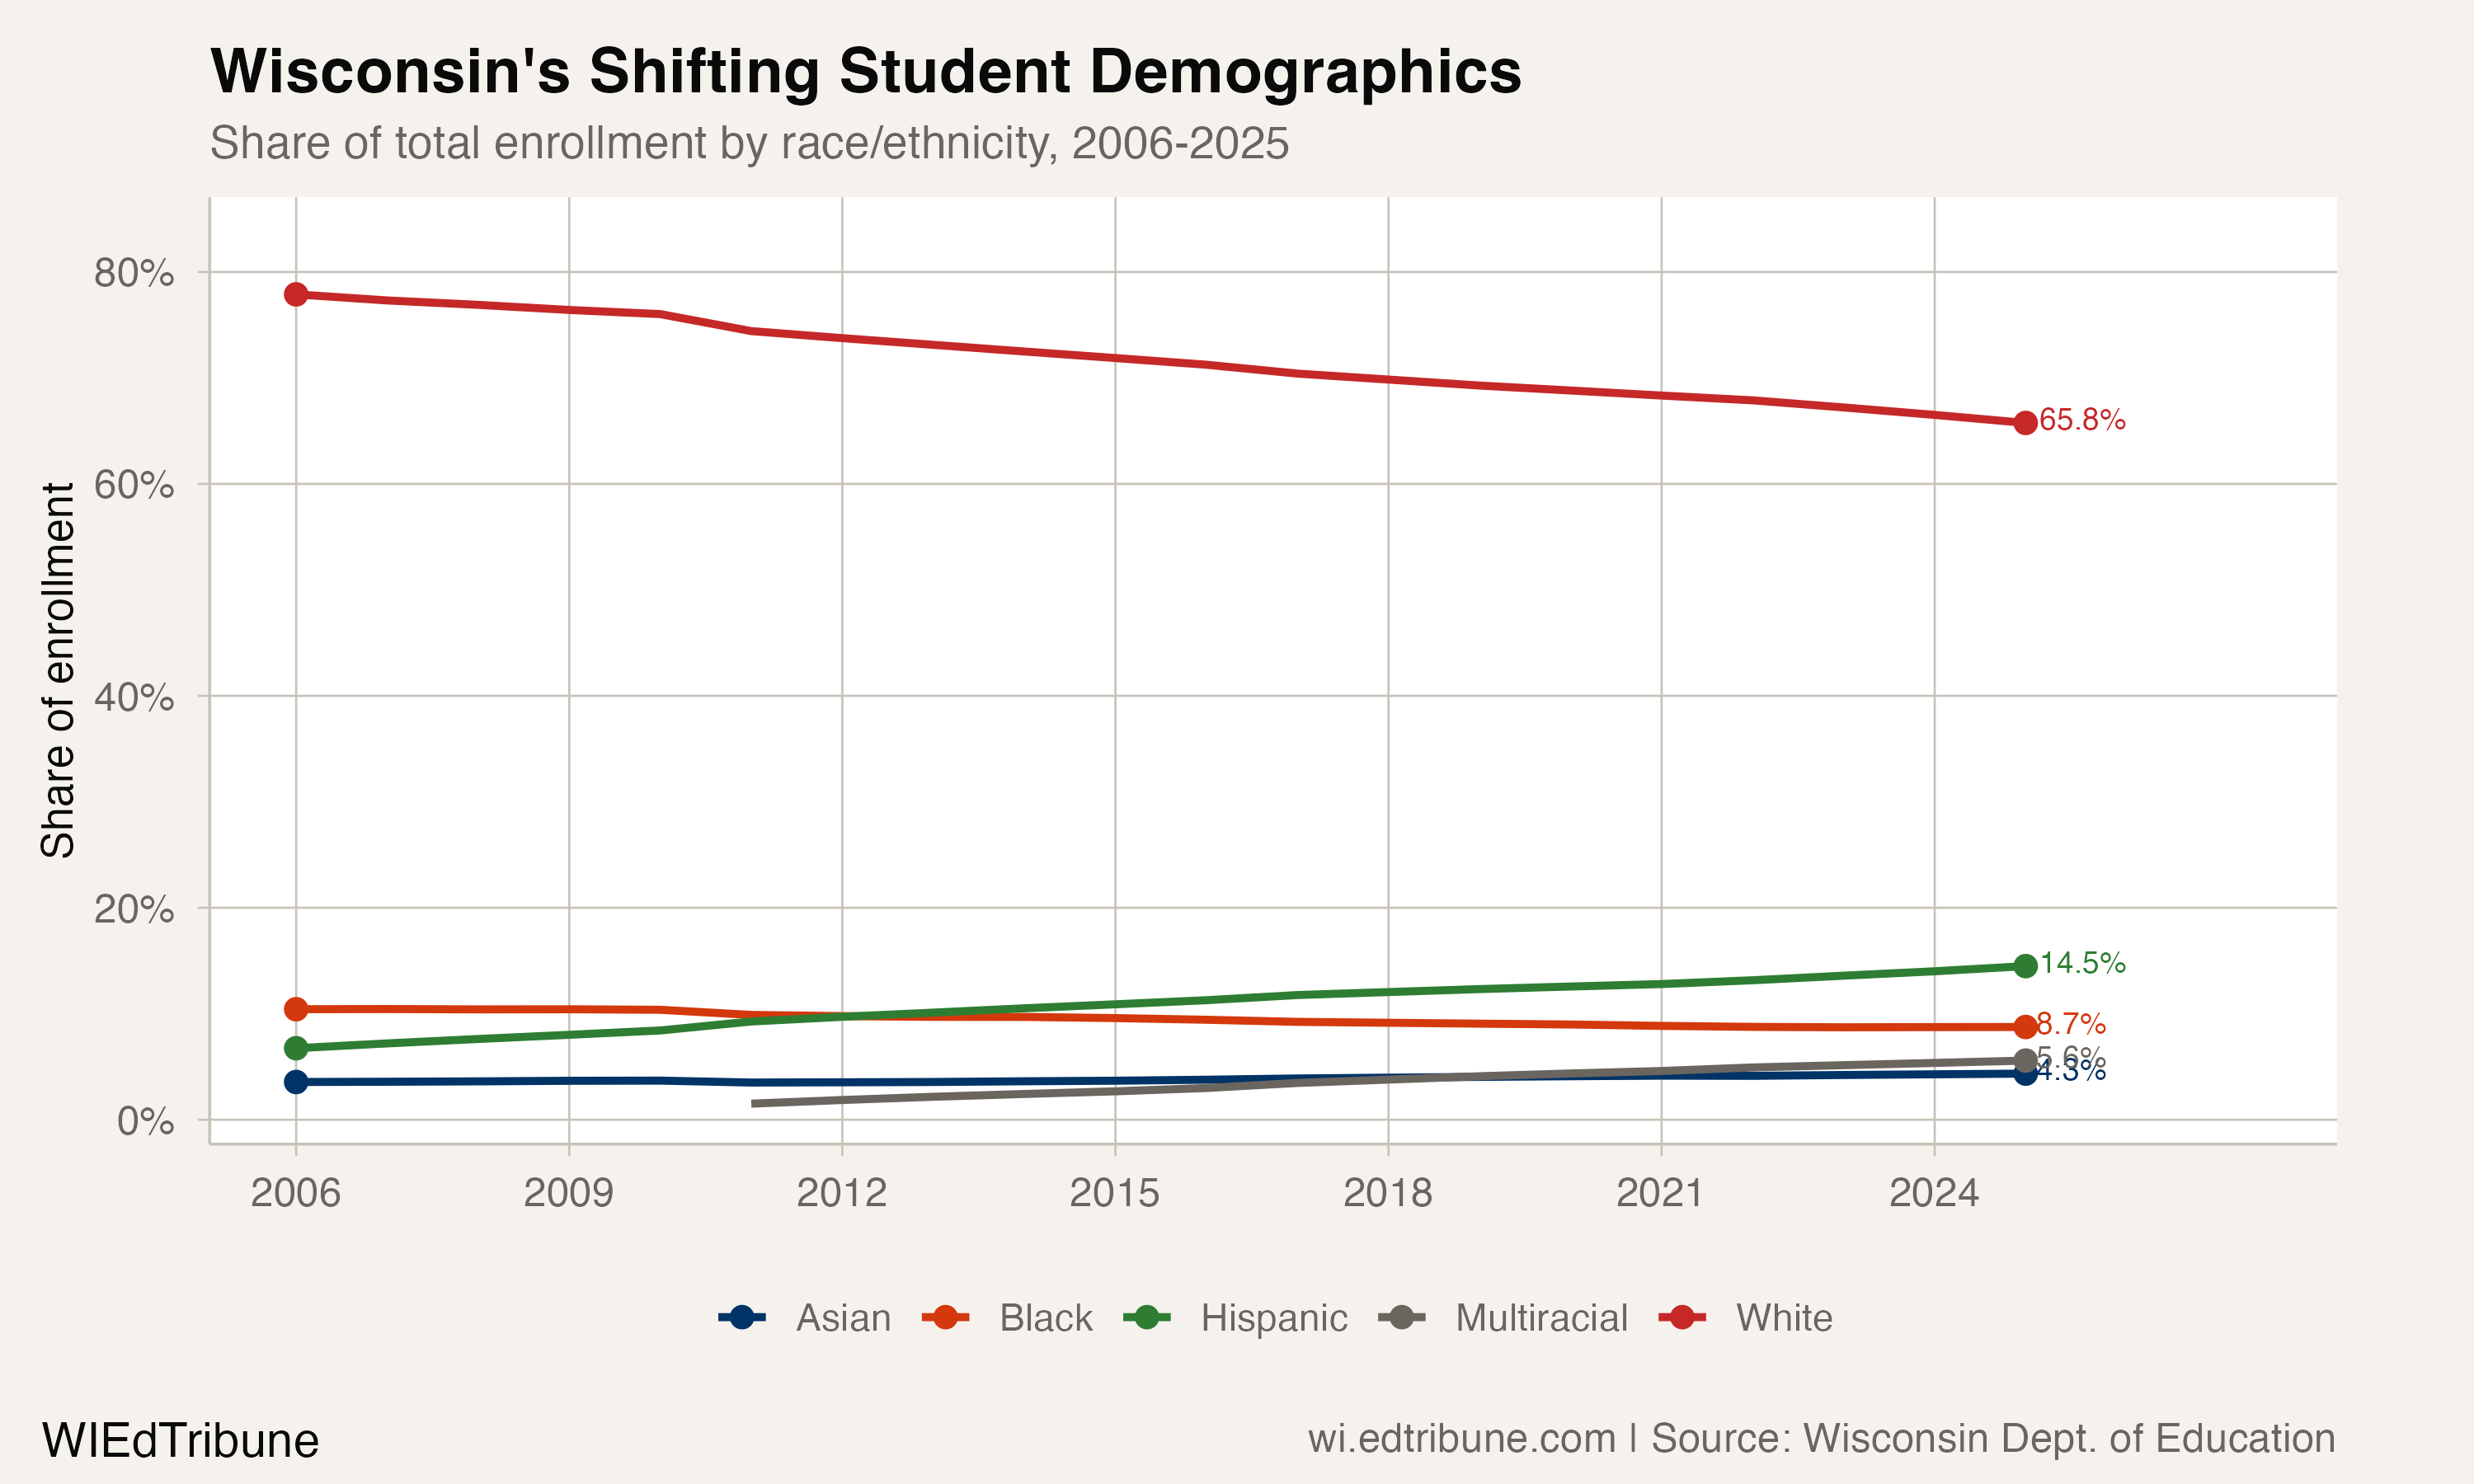
That arithmetic only works one way: non-white enrollment collectively grew by 82,835 students over the same period, more than absorbing Black and Native American declines. Hispanic enrollment nearly doubled. Multiracial enrollment more than tripled. But none of it was enough to offset the collapse in white enrollment, which fell 22.1% while overall enrollment dropped just 8.0%. White students went from 77.9% of the student body to 65.8%, shedding 12.1 percentage points of share in 19 years.
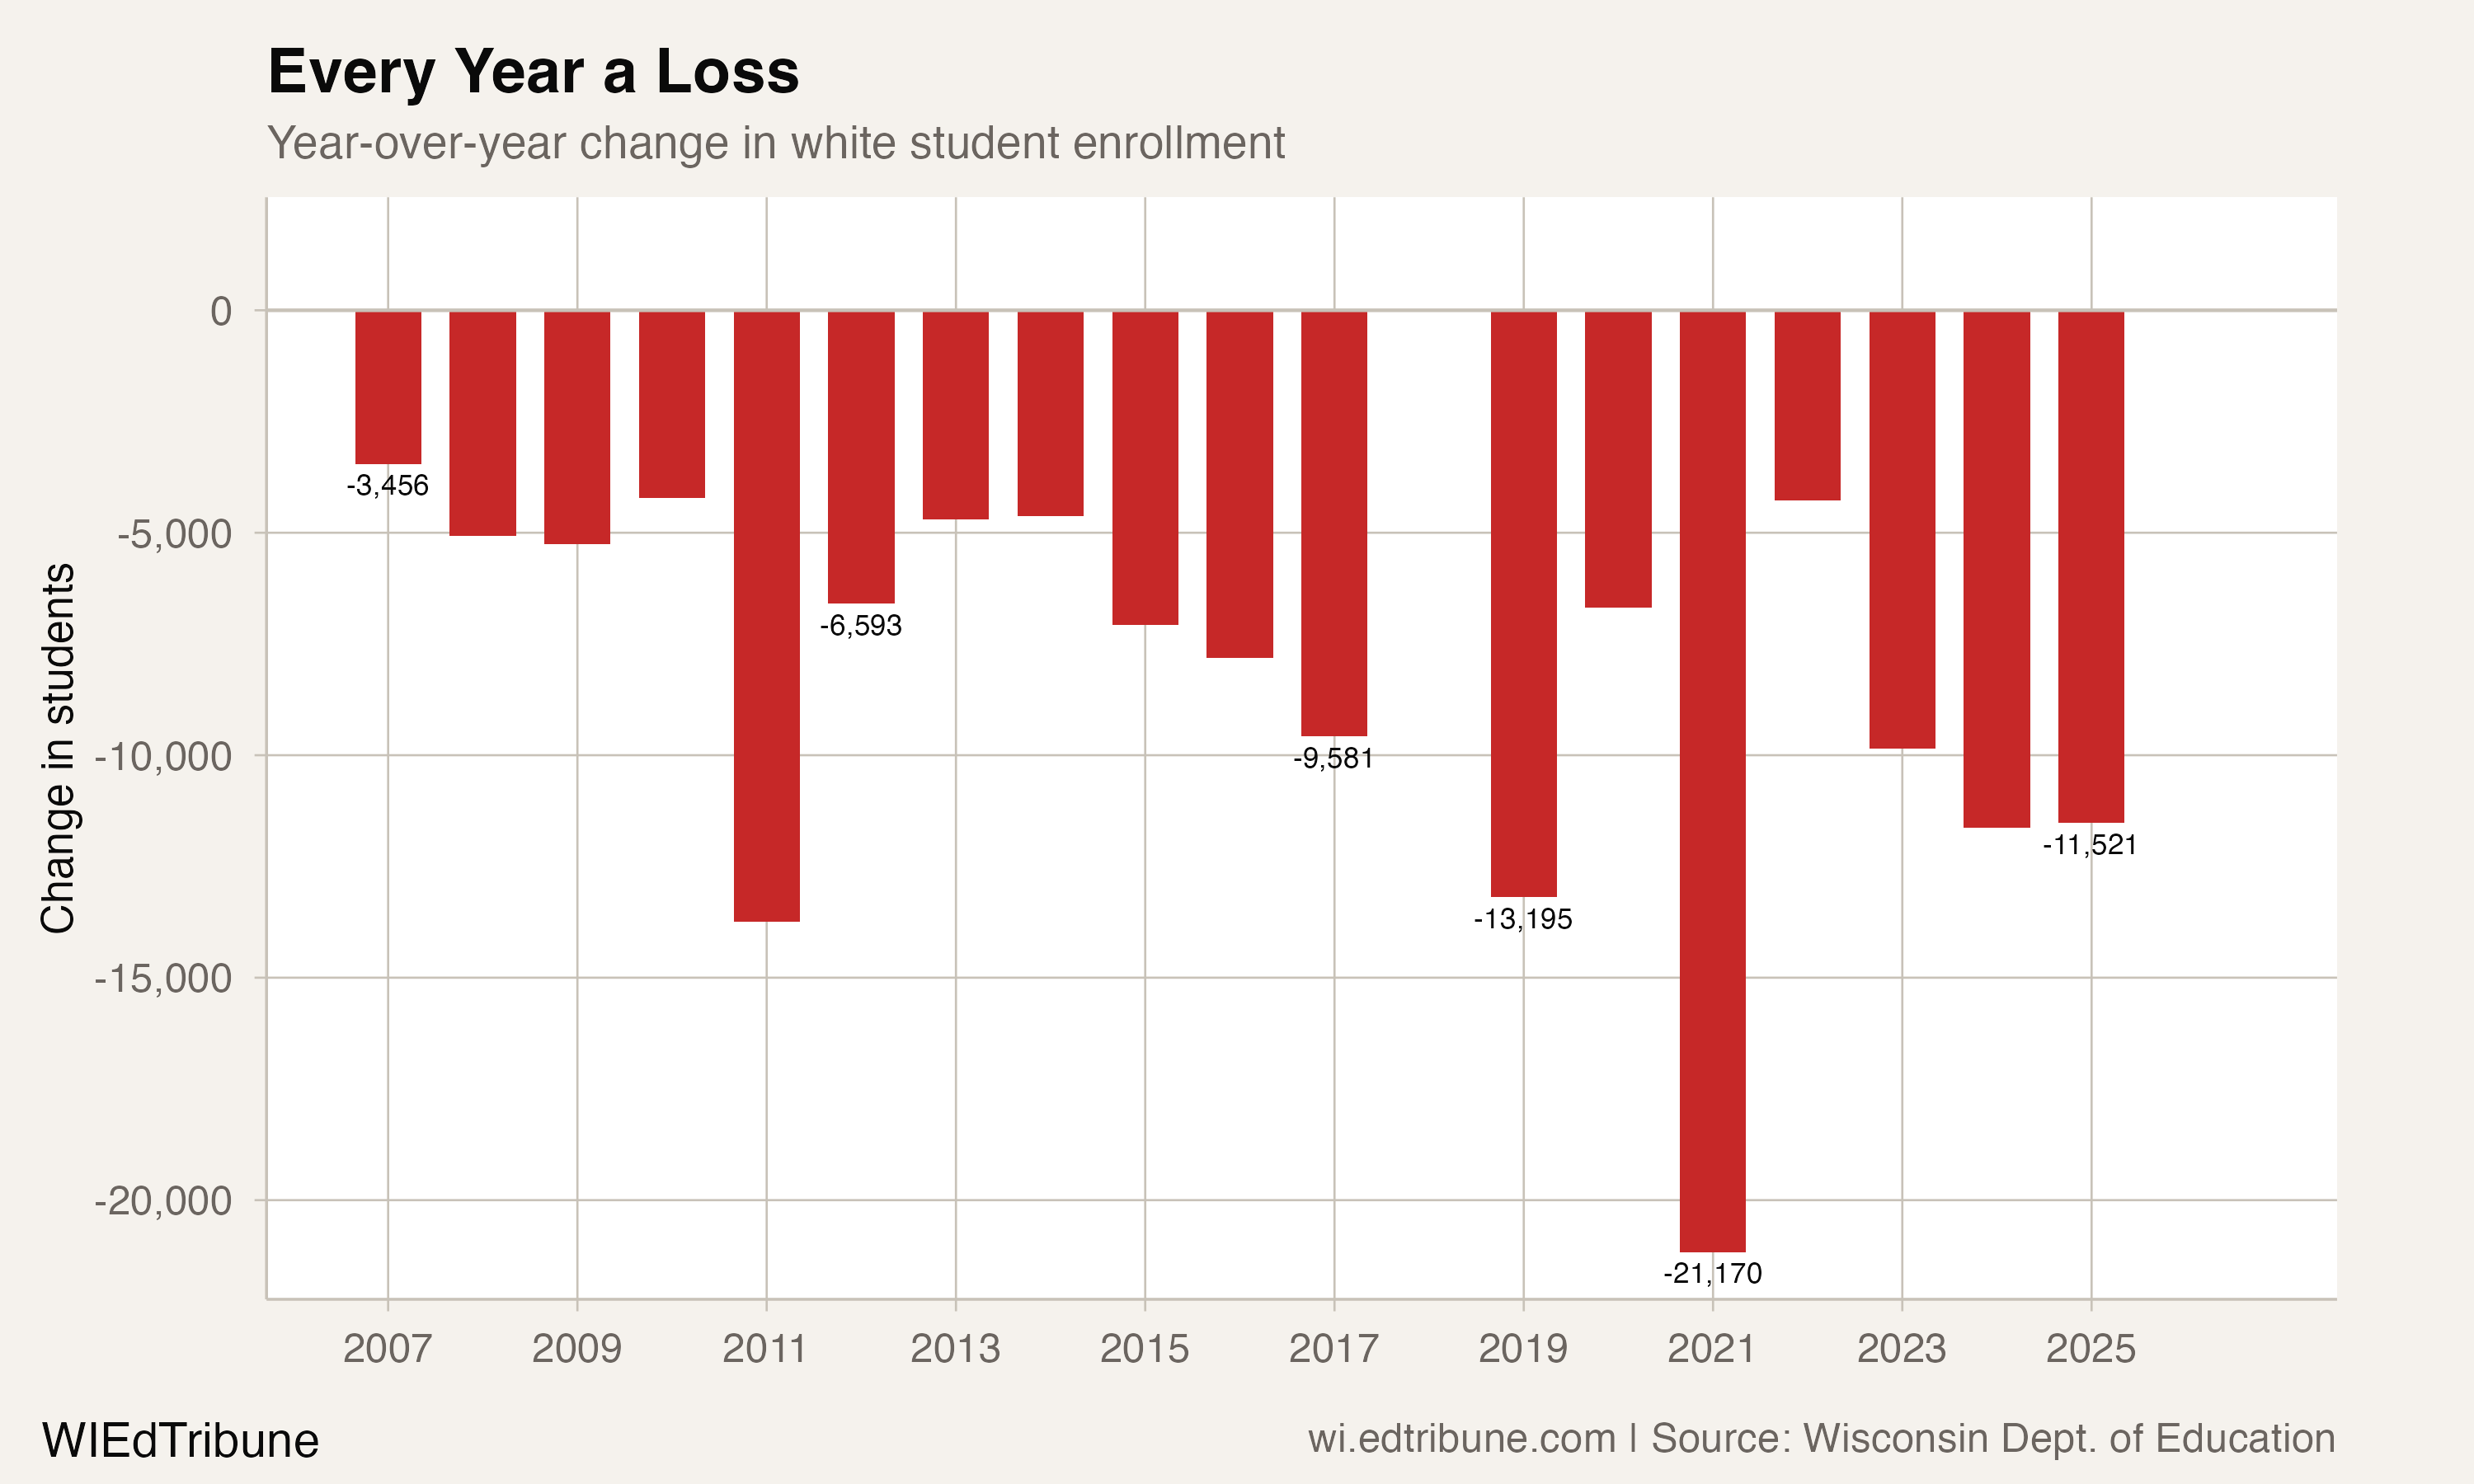
The loss is not slowing down. Over the past five years, Wisconsin has lost an average of 11,689 white students annually, nearly double the 6,391-per-year pace of 2007-2012. Every single observed year in the 19-year dataset recorded a decline. There has not been one year of growth.
A state that adds residents but loses students
The paradox of Wisconsin's enrollment crisis is that the state's total population has been growing. Net migration reached its highest level in 20 years in 2023, with 19,000 new residents arriving. But the people arriving are not the people having children, and the people having children are having fewer of them.
Wisconsin's birth rate has fallen by nearly 22% over the past three decades. In 2024, just 59,675 babies were born in the state, the lowest number since before World War II and an 18% decline from the 2007 peak. Milwaukee alone recorded 7,386 births in 2024, a 22% drop since 2019. In 29 of the state's 46 rural counties, deaths now outnumber births.
The birth rate decline has been steepest among white families, mirroring national patterns. Wisconsin has remained below replacement-level fertility since 1974, and the Applied Population Laboratory at UW-Madison projects total public school enrollment will fall an additional 6.2% to 7.7% in just the next five years, with a 13% to 15% decline projected over the next decade.
Who is replacing whom
The white enrollment decline is not happening in isolation. It is one half of a demographic transformation.
Hispanic enrollment rose from 58,939 (6.7%) to 116,817 (14.5%), a 98.2% increase. Hispanic students are now the second-largest demographic group in Wisconsin schools, having surpassed Black students, whose enrollment fell 22.6% from 91,073 to 70,514. Multiracial students, tracked only since 2011, surged 240.7% from 13,197 to 44,968, now comprising 5.6% of enrollment. Asian students grew 12.8%.
The net effect: non-white students added 82,835 seats while white students vacated 150,475. The gap between those two figures, 67,640, is the state's total enrollment decline.
The acceleration
The year-over-year data tells a story of acceleration. In the early period of 2007-2012, white enrollment fell by an average of 6,391 students per year. By 2021-2025, that average had climbed to 11,689, an 83% increase in the annual rate of loss.
The COVID year of 2020-21 produced the single largest one-year white enrollment drop: 21,170 students vanished from public school rolls. The white student body shrank 3.6% in a single year. Before and after COVID, the trajectory was already pointed sharply downward, but the pandemic appears to have permanently removed a cohort of white families who chose private schools, homeschooling, or left the state and never returned.
The state's four private school choice programs enrolled 60,972 students in 2025-26, with nearly $700 million in annual state funding flowing to voucher schools. About 46% of all Wisconsin private school students now receive a taxpayer-funded voucher. While the voucher programs serve students of all backgrounds, the growth of private alternatives provides one channel through which families can leave public schools without leaving the state.
14 districts crossed below majority-white
The geographic story of white enrollment decline plays out at every scale.
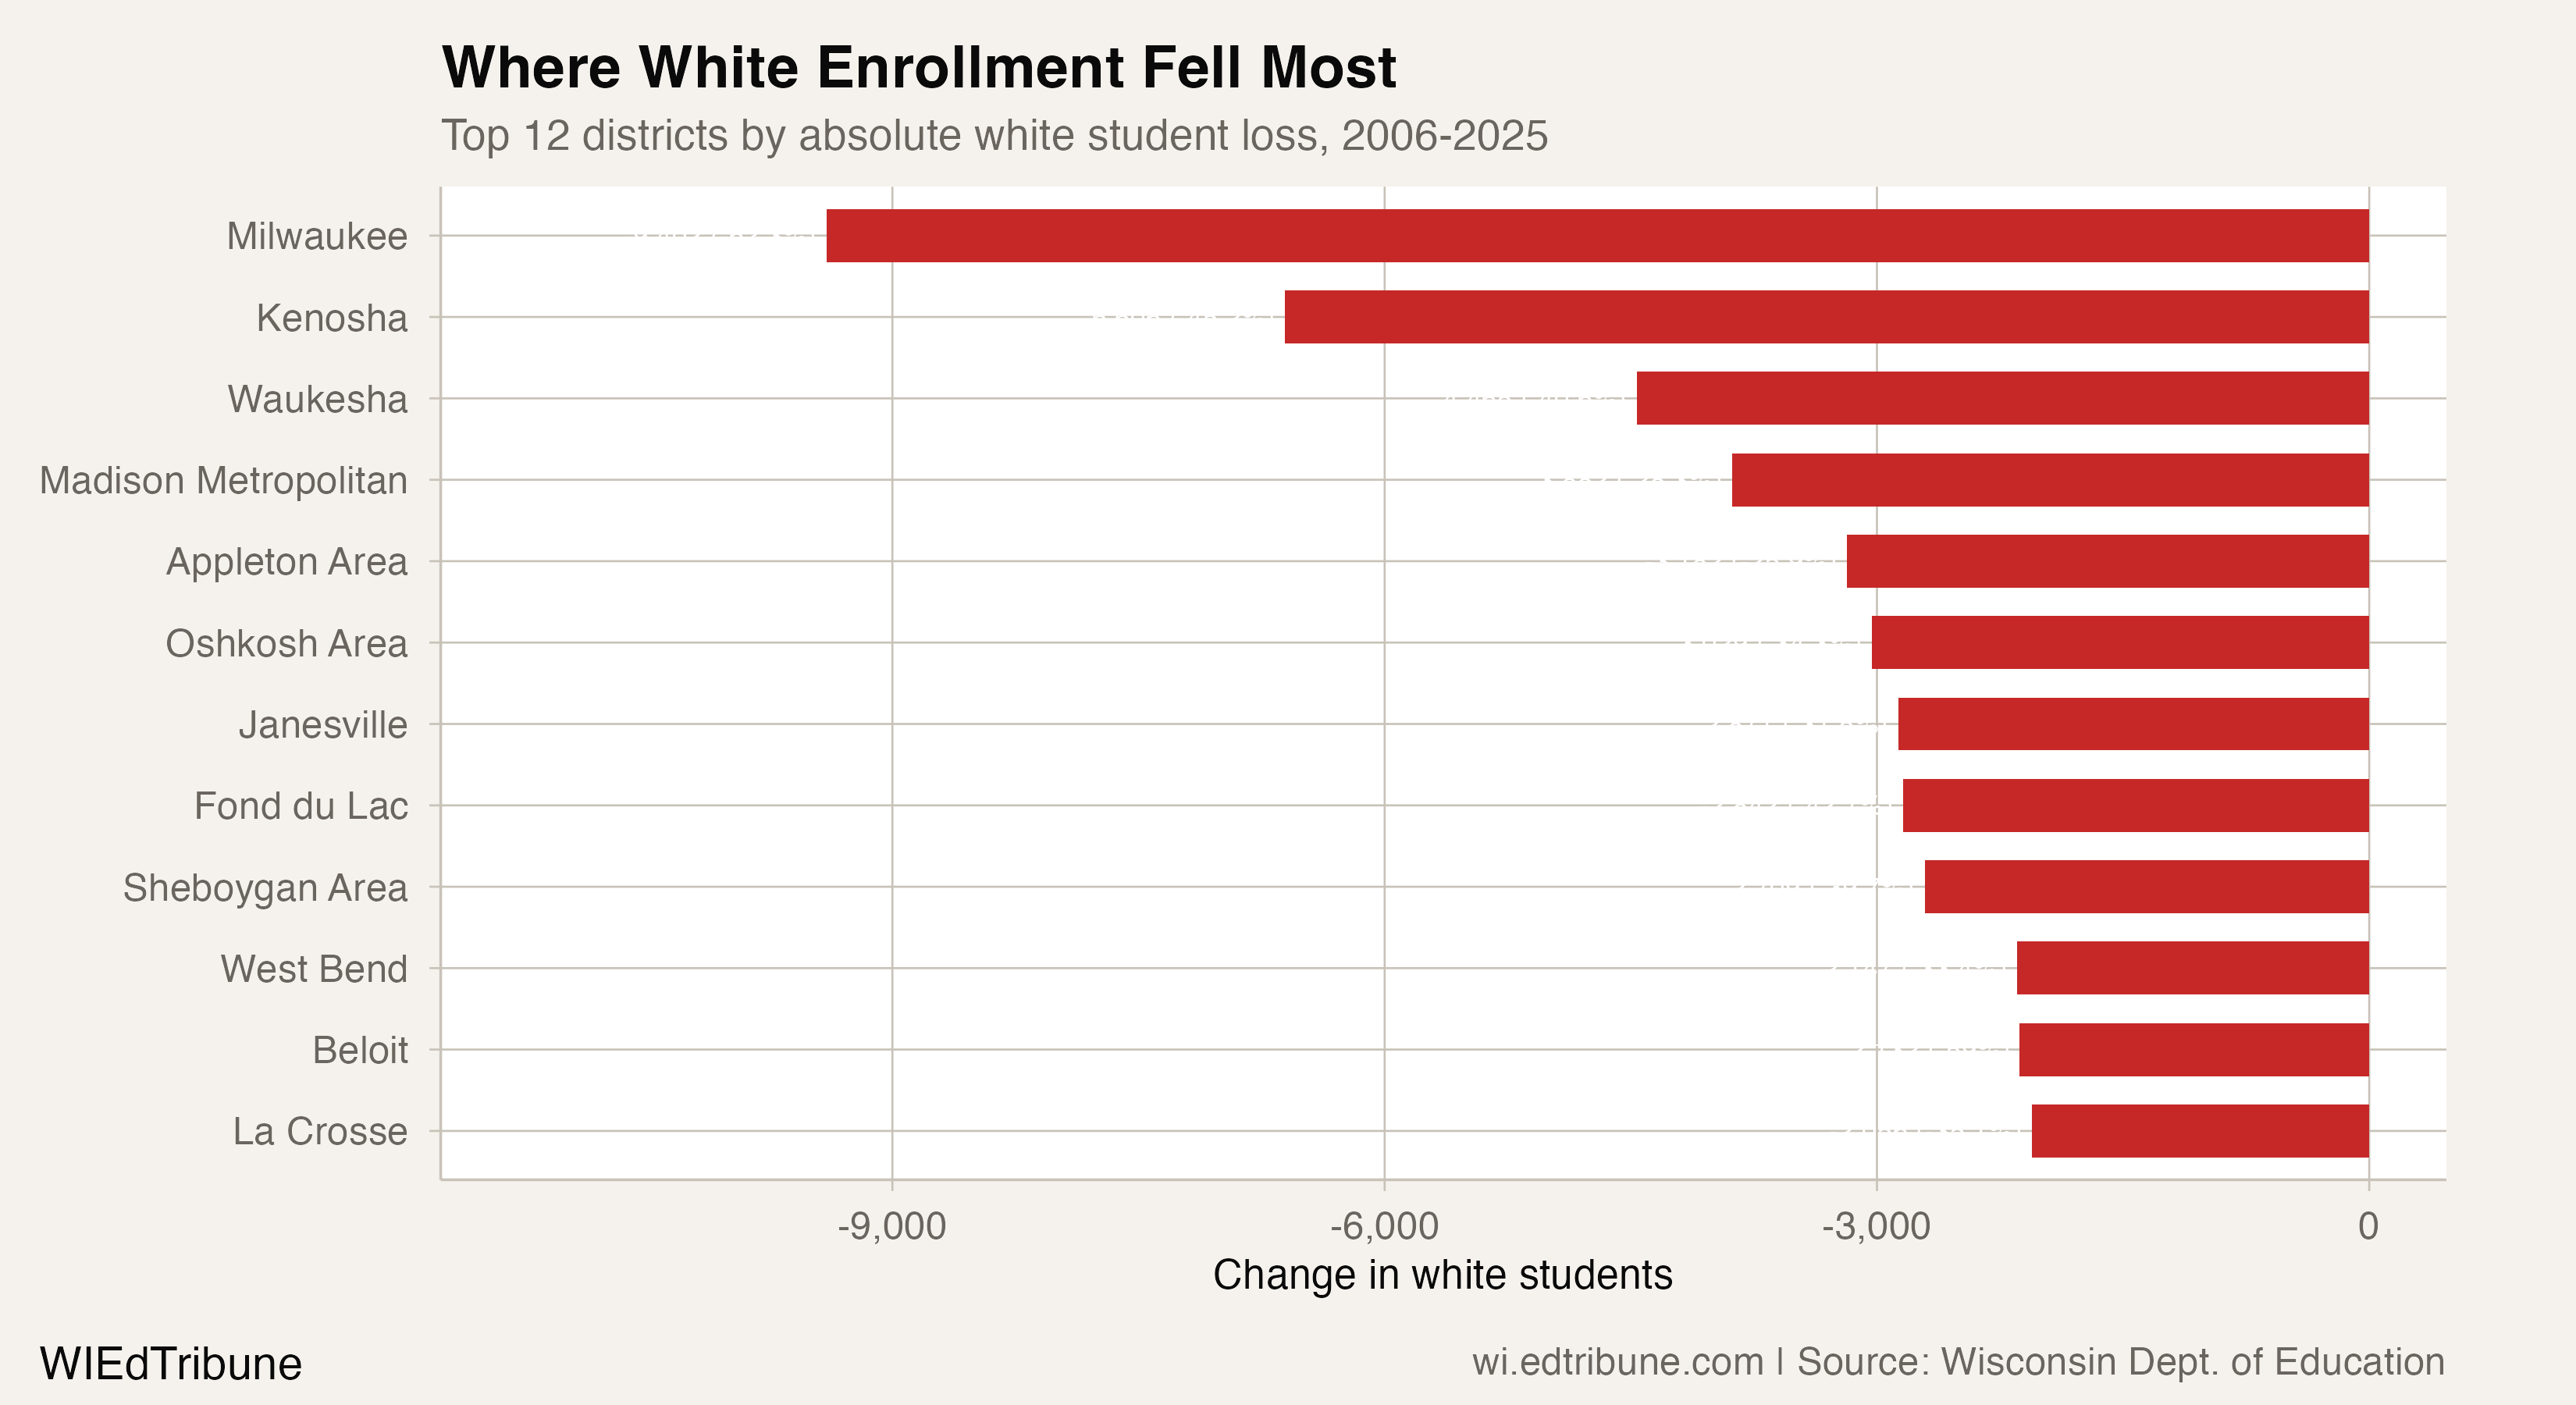
Milwaukee↗ET lost 9,402 white students, a 62.3% decline from 15,087 to 5,685. White students now make up just 8.7% of MPS enrollment. Kenosha↗ET lost 6,606 white students (-45.2%) and crossed below 50% white, falling from 66.1% to 43.8%. Waukesha↗ET, the suburban anchor west of Milwaukee, lost 4,465 (-40.6%). Madison Metropolitan↗ET lost 3,882 and is now just 39.1% white, down from 56.1%.
In total, 14 districts that were majority-white in 2006 crossed below 50% by 2025. The most striking transformations occurred in small agricultural communities. Arcadia↗ET went from 89.7% white to 20.0%, a 69.8-percentage-point shift driven by Hispanic growth tied to meatpacking and agricultural employment. Abbotsford↗ET dropped from 84.2% to 28.3%. Independence↗ET fell from 91.5% to 42.4%.
These are not large districts. Arcadia enrolls about 1,600 students. But the scale of demographic change, from nine in ten students being white to one in five within 19 years, is among the fastest documented shifts in the Upper Midwest.
Among larger districts that crossed the threshold, Sheboygan Area↗ET (9,285 students) fell from 66.3% to 44.2% white. Beloit↗ET went from 50.4% to 29.9%. Cudahy↗ET went from 78.0% to 49.0%.
A structural shift, not a crisis
"My hope is that with working with the Legislature, the executive branch and the business community, we can come up with ways to help Wisconsin address the demographic challenge." -- UW System President Jay Rothman, Daily Cardinal, Jan. 2025
Rothman was speaking about the university system's own enrollment pressures, but the same force, fewer young people born to an aging white population, is the primary driver in K-12. The state's population is projected to decline by nearly 200,000 residents by 2050 absent a sustained increase in immigration.
The distinction matters because the white enrollment decline is not primarily driven by families fleeing public schools, although school choice programs have grown substantially. It is primarily a birth cohort story: there are simply fewer white children being born in Wisconsin each year. Only 6.8% of the state's population growth in 2024 came from natural increase (births minus deaths); the remaining 93% came from migration.
The multiracial enrollment surge of 240.7% since 2011 also complicates the narrative. Some portion of the white enrollment decline may reflect reclassification rather than population loss. Families that previously identified children as white may now identify them as multiracial. The 240.7% surge in multiracial enrollment since 2011 is consistent with both genuine demographic change and a shift in how families fill out enrollment forms.
What to watch next
At the current rate of share decline, 0.65 percentage points per year, white students would drop below 50% of Wisconsin's public school enrollment around 2049. That projection assumes linear continuation of recent trends, which is uncertain in either direction: accelerating birth rate declines could move the crossover earlier, while immigration-driven population growth depends on federal policy.
The more immediate question is fiscal. 68 of 72 Wisconsin counties saw public school enrollment decline in the latest data. Revenue limits have been functionally frozen for 18 consecutive years. Districts passed a record 148 operating referendum questions in 2024, authorizing $4.4 billion in new funding as local taxpayers fill the gap that declining enrollment and flat state aid leave behind.
The demographic composition of Wisconsin's classrooms has changed more in 19 years than it did in the previous half-century. Whether the institutions that serve those classrooms have changed alongside them is a question the enrollment numbers alone cannot answer.
Detailed code that reproduces the analysis and figures in this article is available exclusively to EdTribune subscribers.
Discussion
Sign in to join the discussion.
Loading comments...