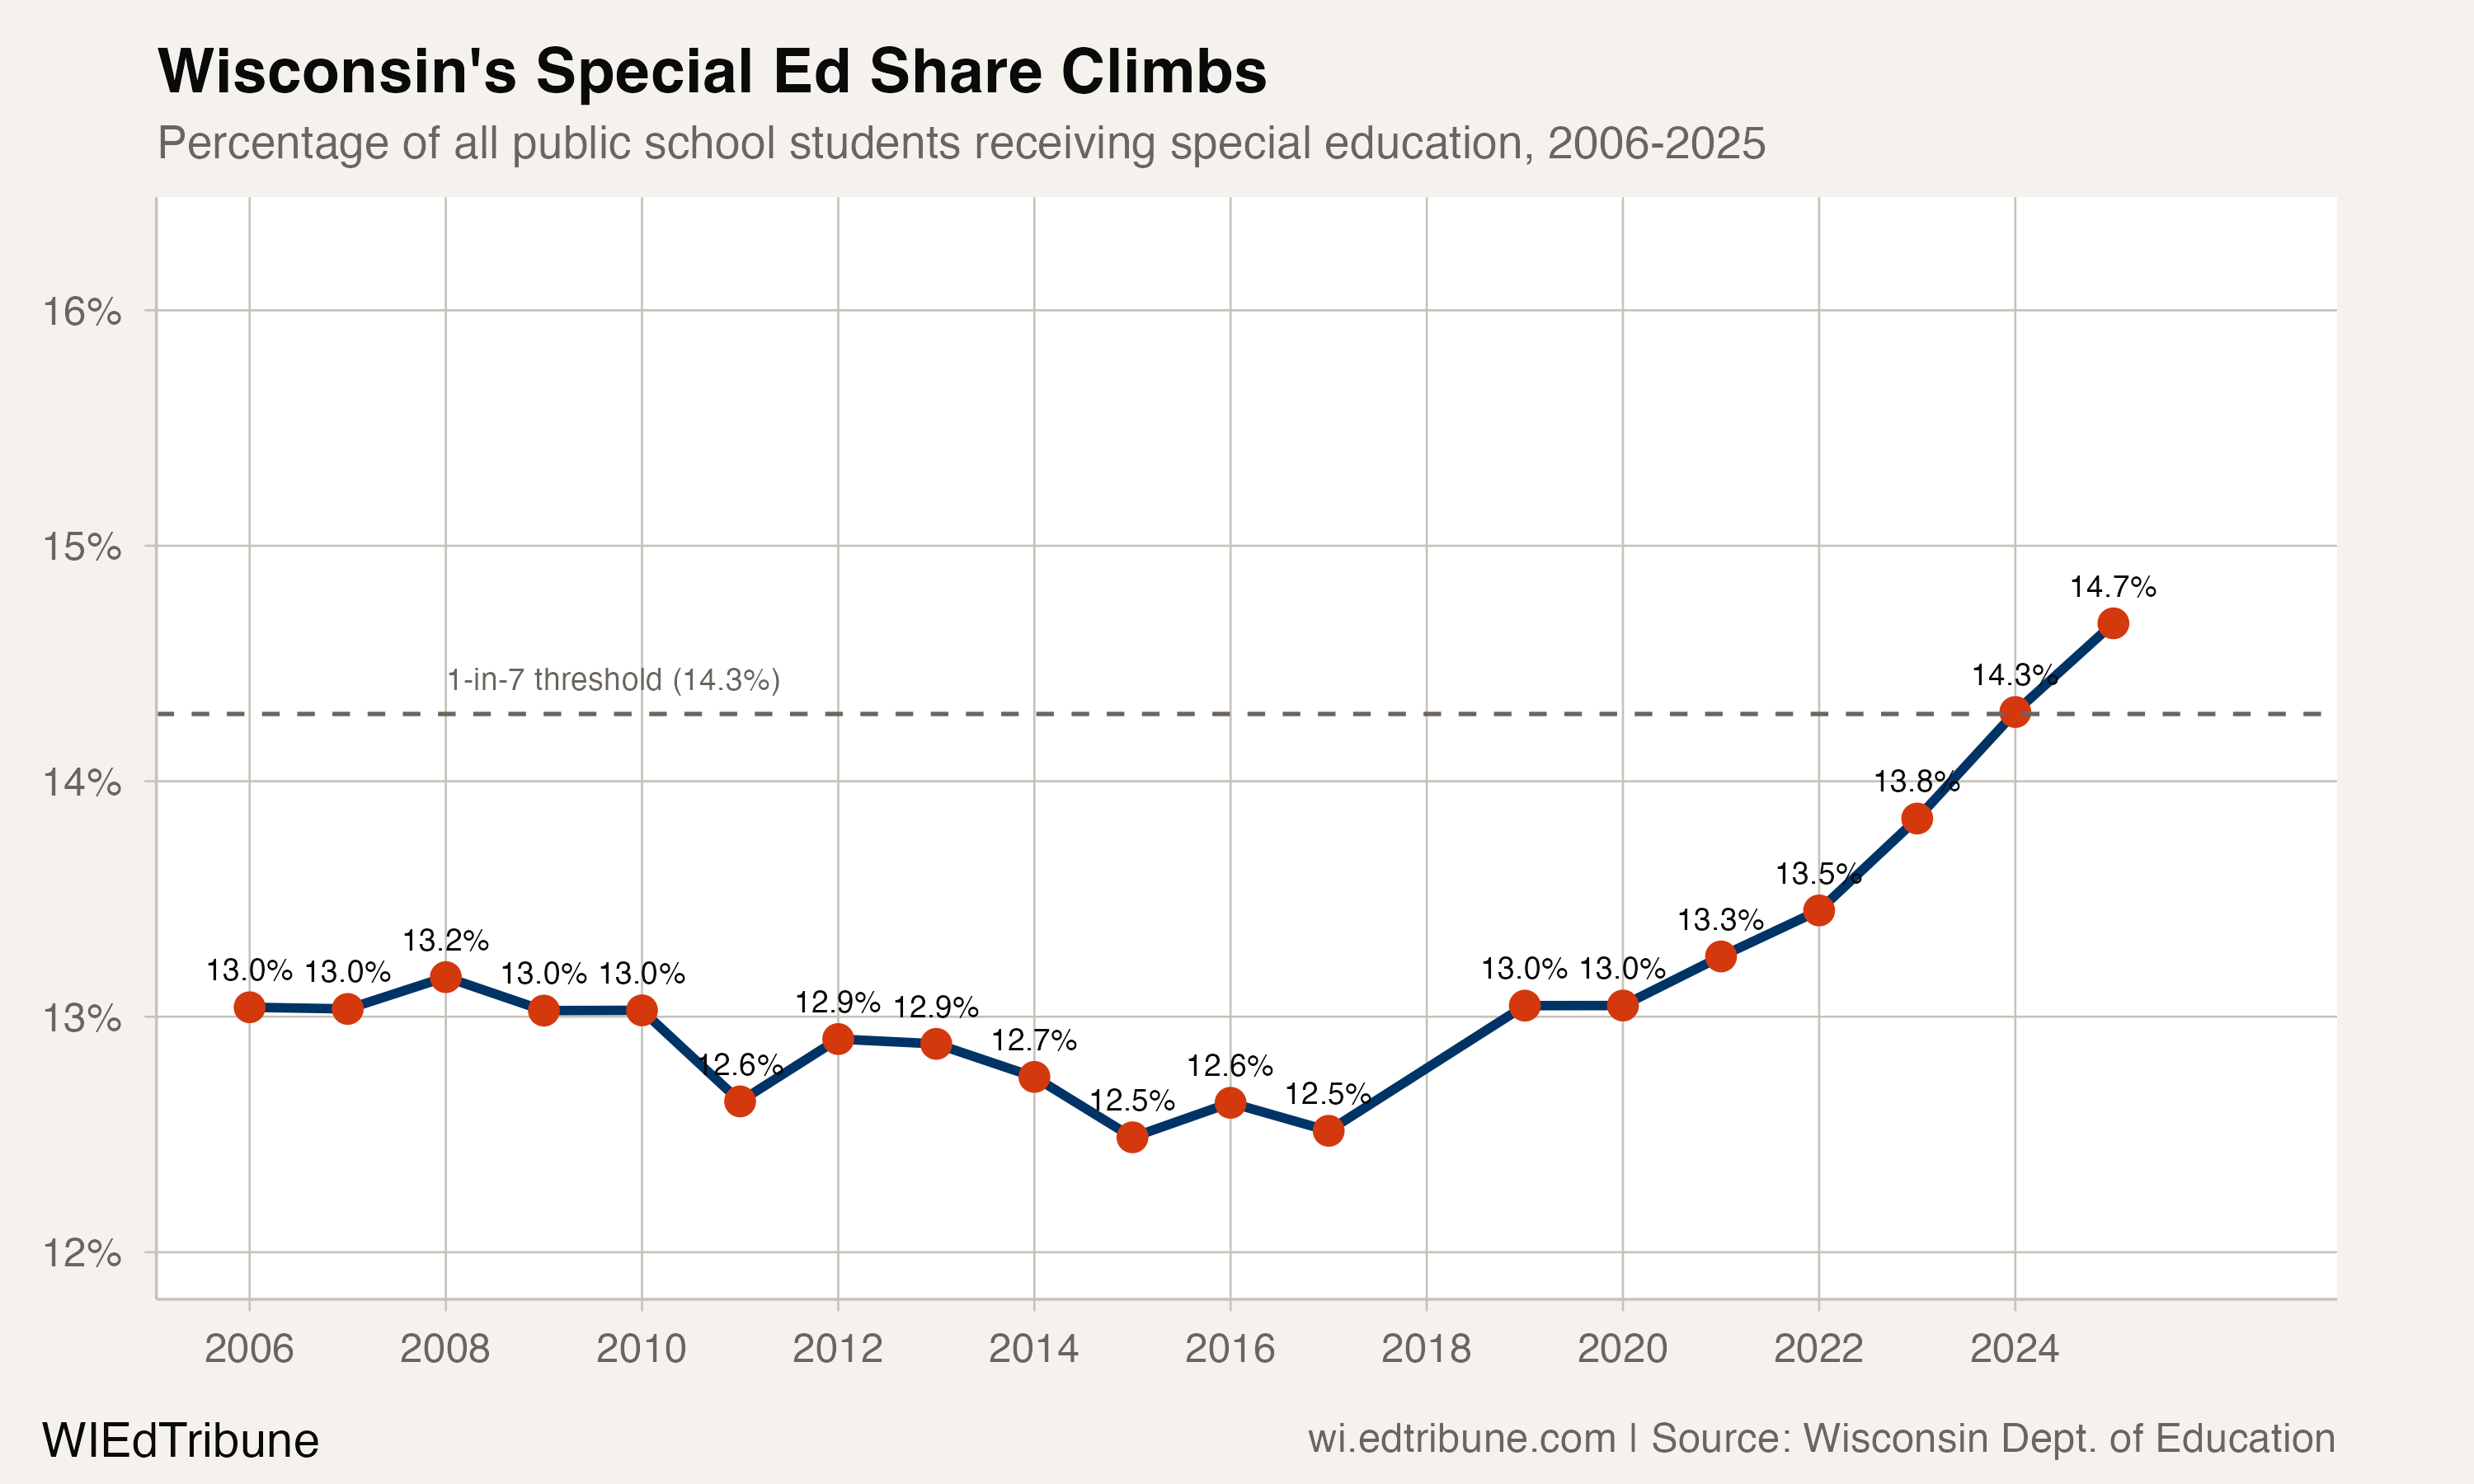
For most of the past two decades, Wisconsin's special education share held steady near 13%, fluctuating in a narrow band. That stability ended around 2019. In the six years since, the share has climbed 1.6 percentage points to 14.7%, blowing past the 1-in-7 threshold and reaching a level the state has never recorded. The 118,228 students receiving special education services in 2025-26 represent not just an all-time high in share, but an all-time high in absolute numbers, even as total enrollment has fallen by 52,952 students over the same period.
The state now has more students entitled to Individualized Education Programs than at any point in its history, while the classroom workforce serving those students has contracted nearly 20% in purchasing power since 2010.
The share climbed while everything else fell
Wisconsin's special education trajectory has two distinct eras. From 2006 through 2017, the share drifted downward, bottoming at 12.5%. That trough coincided with tighter identification standards and budget pressure that followed Act 10. Starting in 2019, the share reversed sharply, gaining 0.53 percentage points in a single year and then climbing in every subsequent year except during the pandemic disruptions of 2020-21, when referrals and evaluations were delayed.
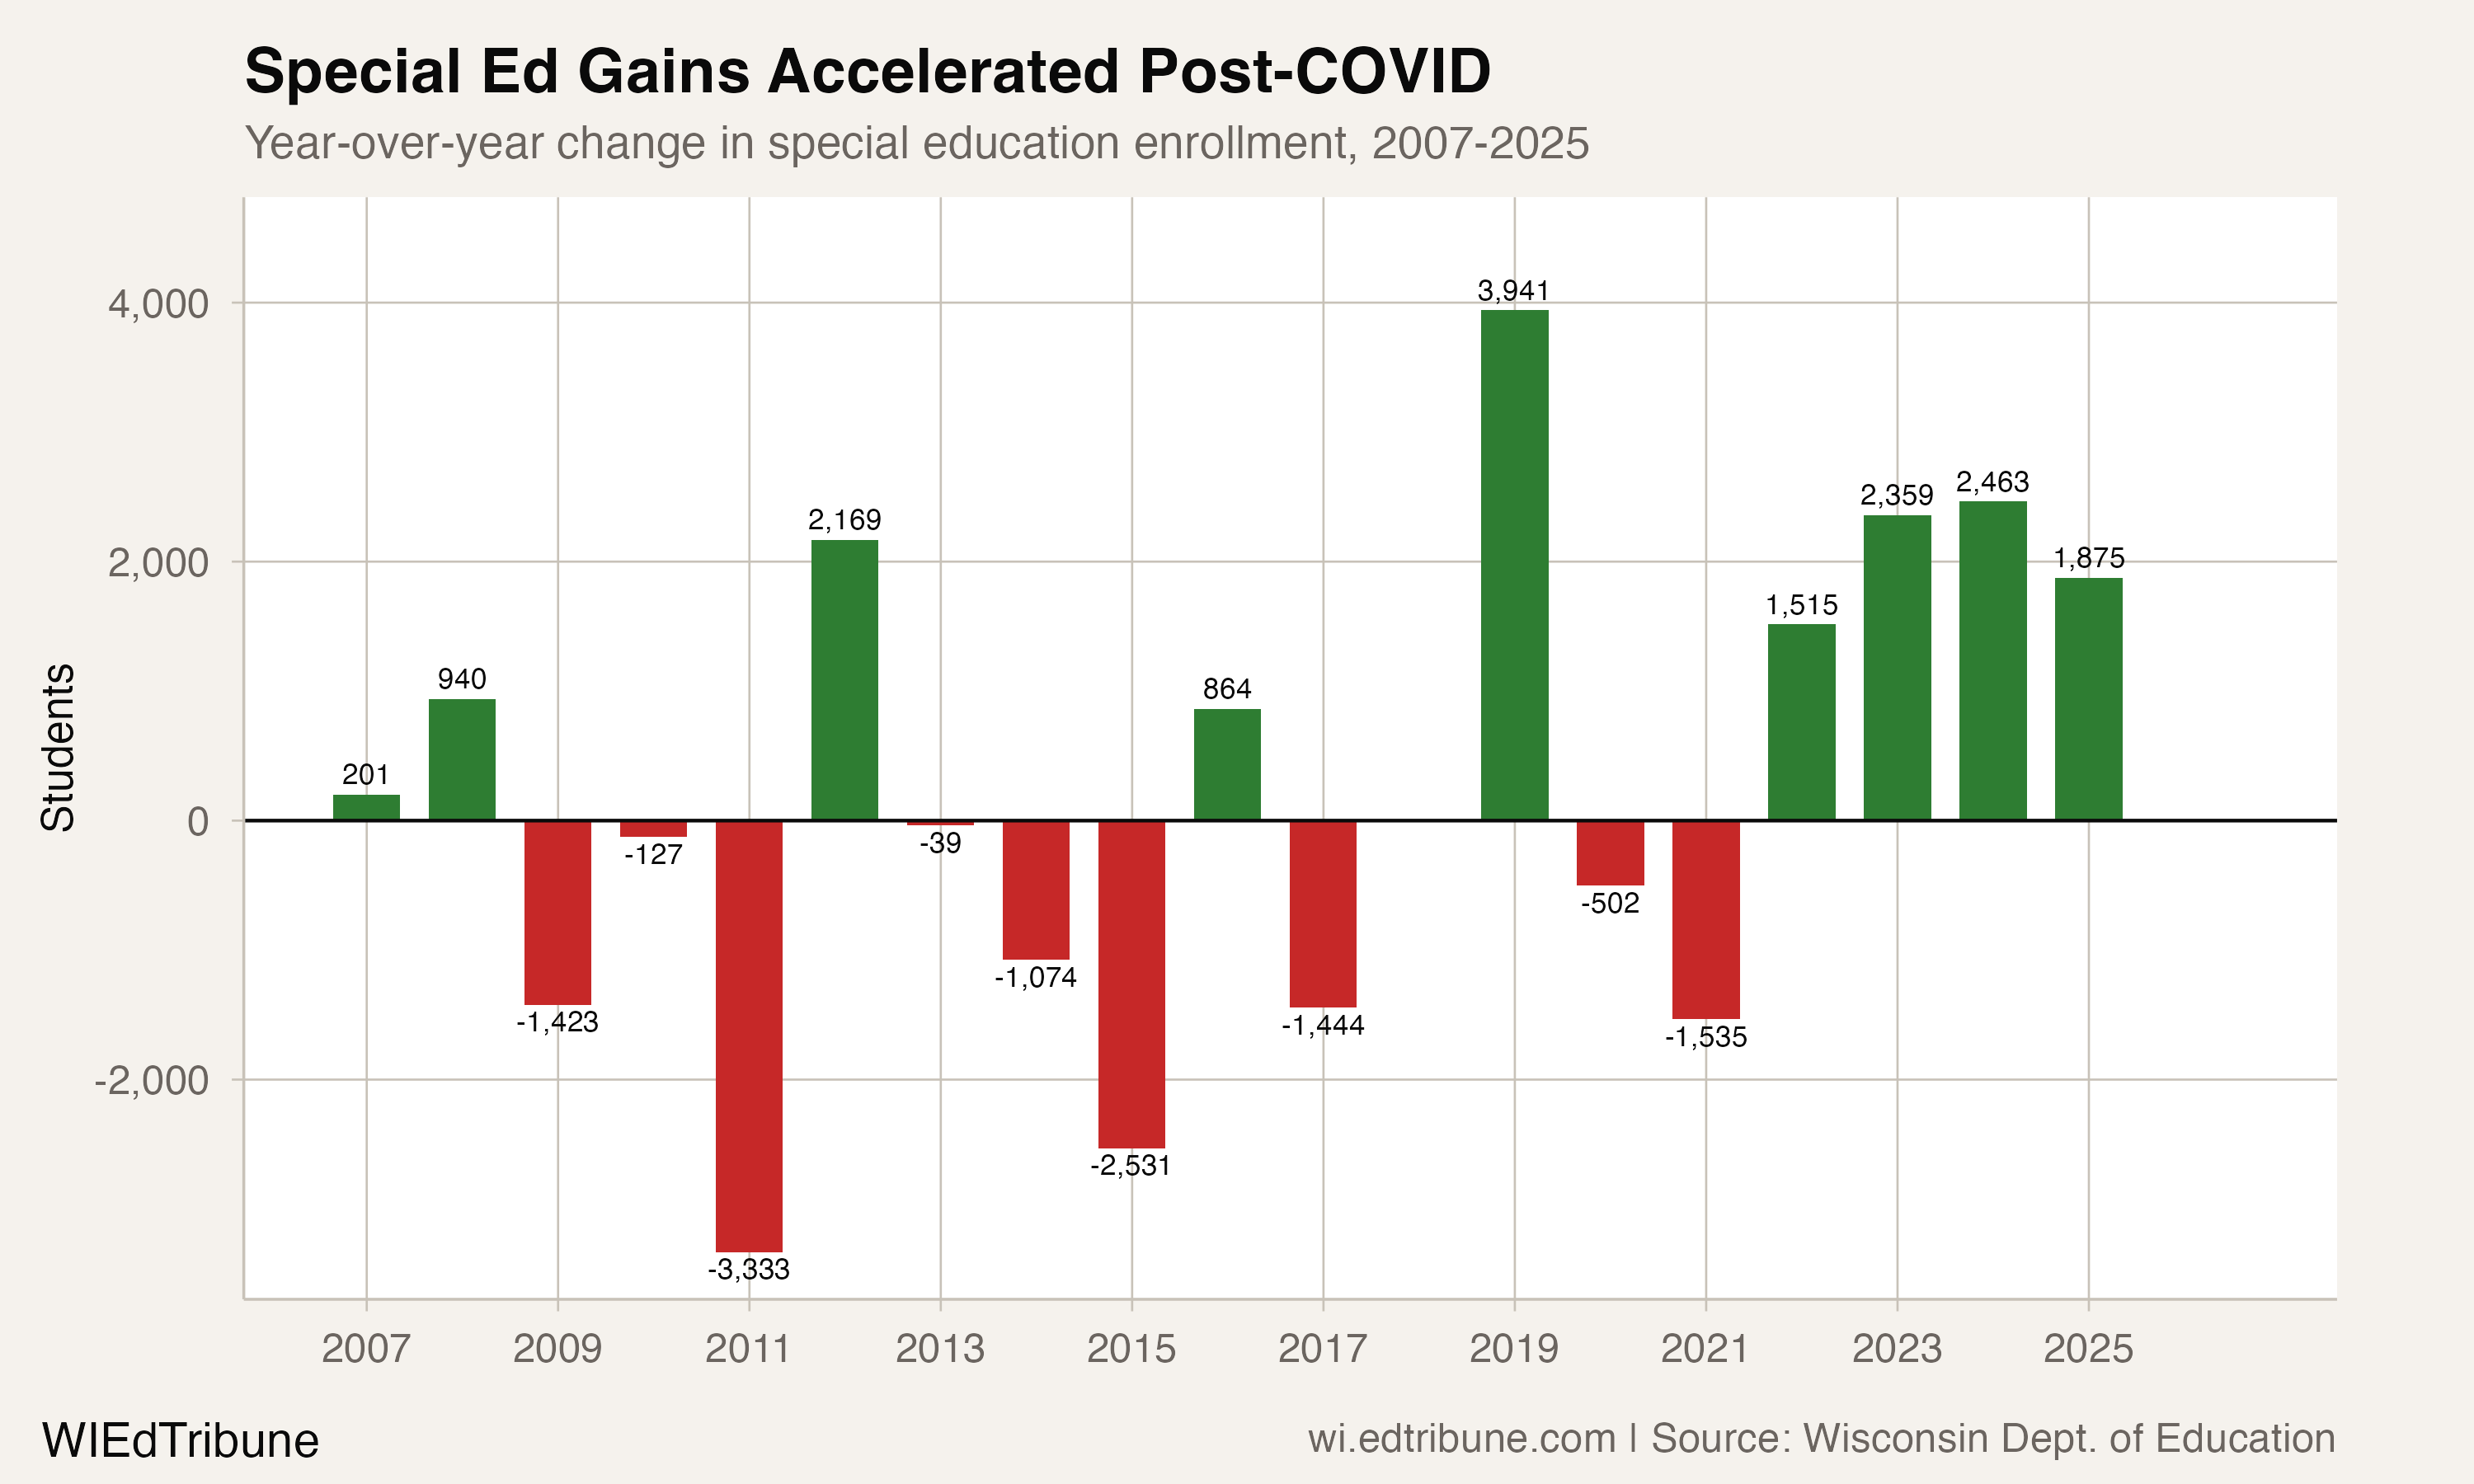
Since 2022, the gains have been consistent: 1,515 additional special education students in 2022, 2,359 in 2023, 2,463 in 2024, and 1,875 in 2025. Total enrollment, meanwhile, dropped by 8,121 in 2025 alone. The arithmetic is straightforward: more students receiving services divided by fewer students total produces an accelerating share increase.
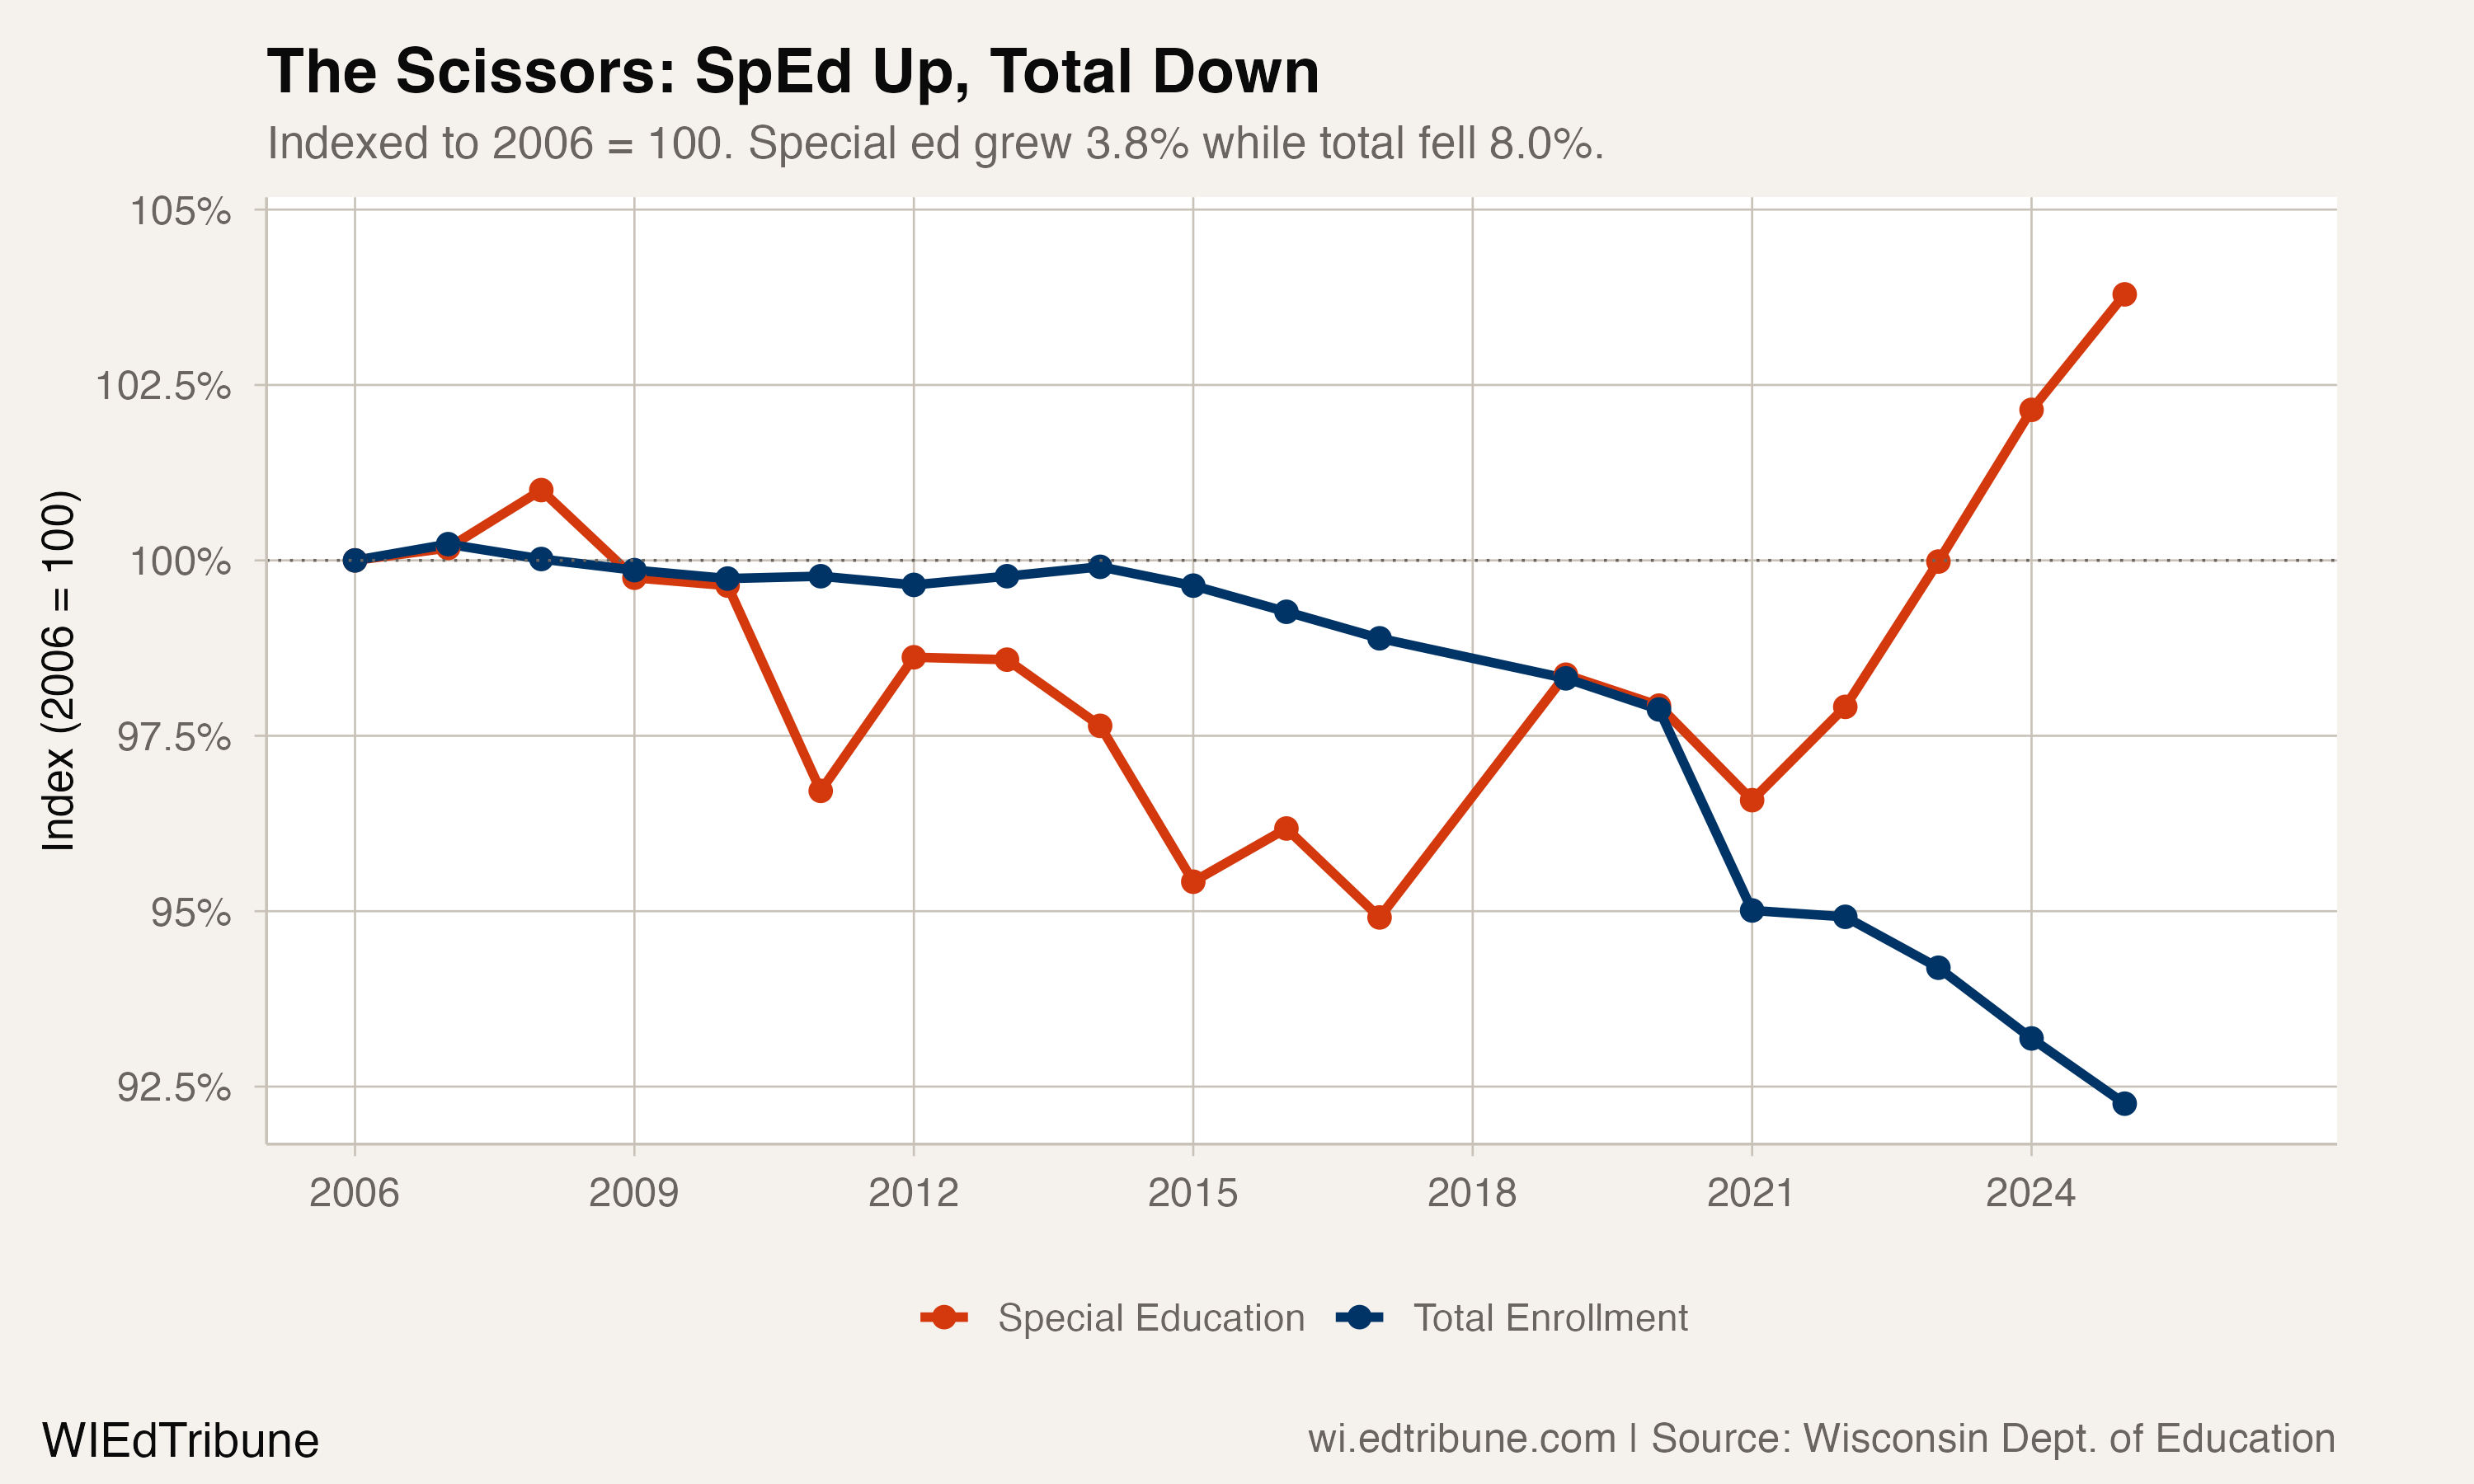
Indexed to 2006, the divergence is stark. Total enrollment has fallen to 92.3% of its 2006 level. Special education enrollment has risen to 103.8%. The two lines crossed in opposite directions around 2019 and have been widening since.
What is behind the increase
The most likely driver is expanded identification, not an influx of students with newly acquired disabilities. Nationally, the number of IDEA-eligible students increased 3.8% in 2024, with autism accounting for 40% of the total increase. Wisconsin's pattern fits this national trend: greater clinical awareness of autism spectrum disorder, broader use of universal screening tools in early grades, and post-pandemic attention to learning delays have all contributed to higher identification rates.
A second contributing factor is the pandemic itself. Children who missed developmental milestones during remote learning in 2020-21 entered the evaluation pipeline in 2022 and 2023 as schools caught up on deferred referrals. The 2019 jump of 3,941 students, the largest single-year gain in the dataset, preceded COVID but aligned with a DPI push to improve evaluation timelines and reduce identification disparities across racial groups.
There is a competing explanation worth noting. If families of students without disabilities are disproportionately leaving public schools for voucher programs, homeschooling, or open enrollment transfers, the special education share would rise mechanically even without any change in identification. Wisconsin's three parental choice programs now serve tens of thousands of students statewide. The data cannot distinguish how much of the share increase reflects genuine identification growth versus compositional change from departing general education students. Both forces are likely operating simultaneously.
The funding gap this creates
The fiscal consequences are not abstract. Wisconsin reimburses school districts for a fraction of their special education costs, and that fraction has been a source of persistent tension. The state's 2025-27 budget estimated a 42% reimbursement rate for 2025-26, but actual payments came in at roughly 35%, according to Legislative Fiscal Bureau analysis published in November 2025. The gap was caused by special education costs growing 9% year-over-year, more than double the 4% projection used when the budget was drafted.
"Shortfall will mean even more communities forced into holding school referendums in 2026 just to meet basic needs." -- Peggy Wirtz-Olsen, WEAC president, November 2025
The unreimbursed costs are substantial. In 2022-23, public schools absorbed approximately $1.2 billion in special education costs above what the state reimbursed. Rep. Joel Kitchens estimated that districts spend an average of $1,500 per pupil from general funds to cover the shortfall. In a state where revenue limits have been frozen since the CPI adjustment factor was eliminated in 2009, those general fund dollars come directly at the expense of programming for every other student.
Where the burden falls hardest
The statewide average of 14.7% masks enormous district-level variation. Bayfield↗ET, a small district on Lake Superior's south shore, reports a 29.6% special education rate, nearly double the state average. Lac du Flambeau #1↗ET, which serves the Lac du Flambeau Band of Lake Superior Chippewa, is at 26.5%. Both are small districts, under 500 students, where a handful of students with high-cost IEPs can create outsized fiscal pressure.
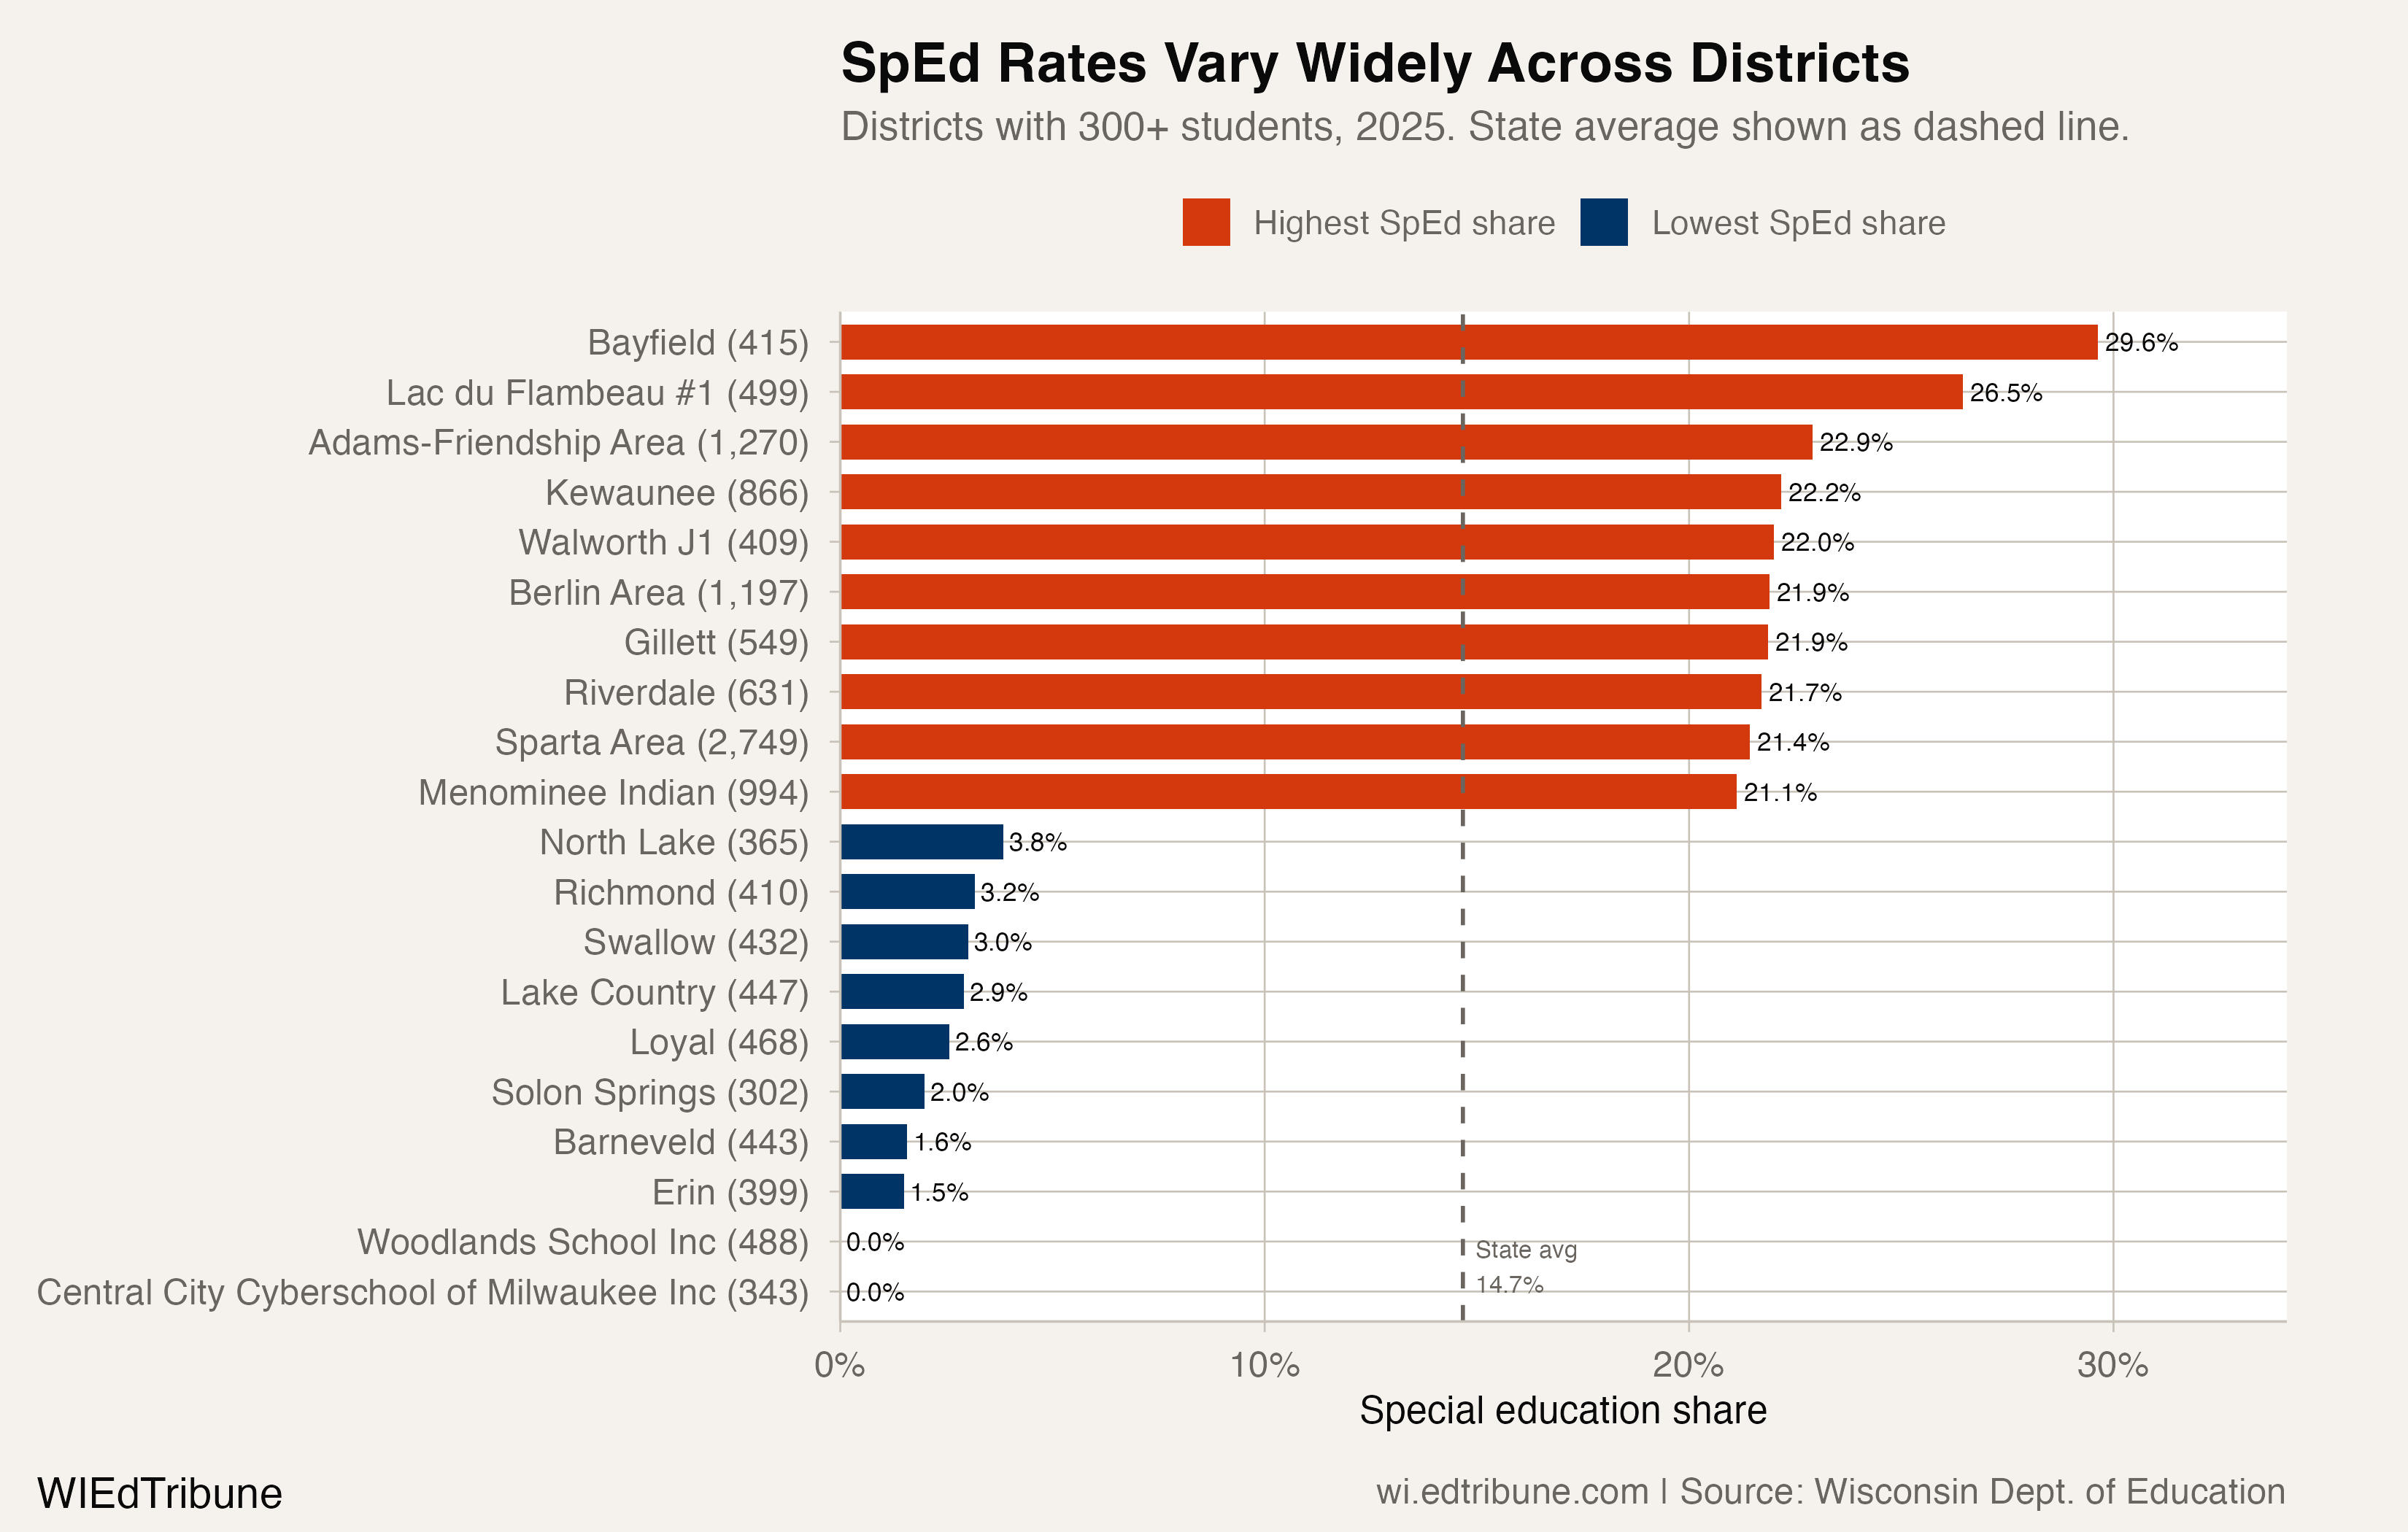
Among large districts, the disparities are equally notable. Milwaukee↗ET leads at 20.2%, meaning one in five MPS students receives special education services. That rate has been above 19% for most of the past 15 years, but MPS now carries it on a base enrollment of 65,599, down from 91,818 in 2006. Racine is at 18.2%, Waukesha at 18.0%, and Green Bay at 17.0%. At the other end, Verona Area↗ET sits at 8.9% and Hamilton at 10.4%, affluent suburban districts where families may be more likely to seek private evaluations or services outside the public system.
The pattern is not random. Higher special education rates correlate with higher poverty, rural isolation, and tribal communities. The 18 districts above 20% are overwhelmingly small, rural, and in northern Wisconsin.
The staffing crisis underneath the numbers
More students entitled to IEPs means more special education teachers, aides, speech pathologists, and occupational therapists needed to serve them. Wisconsin does not have them. Special education remains the state's worst staffing shortage, according to DPI's 2024 workforce report. Nationally, 51% of schools report vacant special education positions, a higher vacancy rate than any other teaching specialty.
"Wisconsin's kids are suffering from losing quality teachers. Solving this challenge starts with upholding the state's responsibility of funding our public schools." -- State Superintendent Dr. Jill Underly, April 2024
Teacher compensation in Wisconsin has declined nearly 20% in real terms since 2010, and 39.4% of first-year teachers leave the state or the profession within six years. For special education teachers specifically, the combination of high caseloads, extensive paperwork, and comparatively low pay makes retention particularly difficult.
Special education is not the only service population growing
English learner enrollment has followed a parallel upward trajectory, rising from 4.5% of enrollment in 2006 to 6.9% in 2025. The two service populations overlap to some degree, as students can be both English learners and receive special education services. Together, they represent a growing share of students whose instructional programs carry higher per-pupil costs, served by a shrinking revenue base.
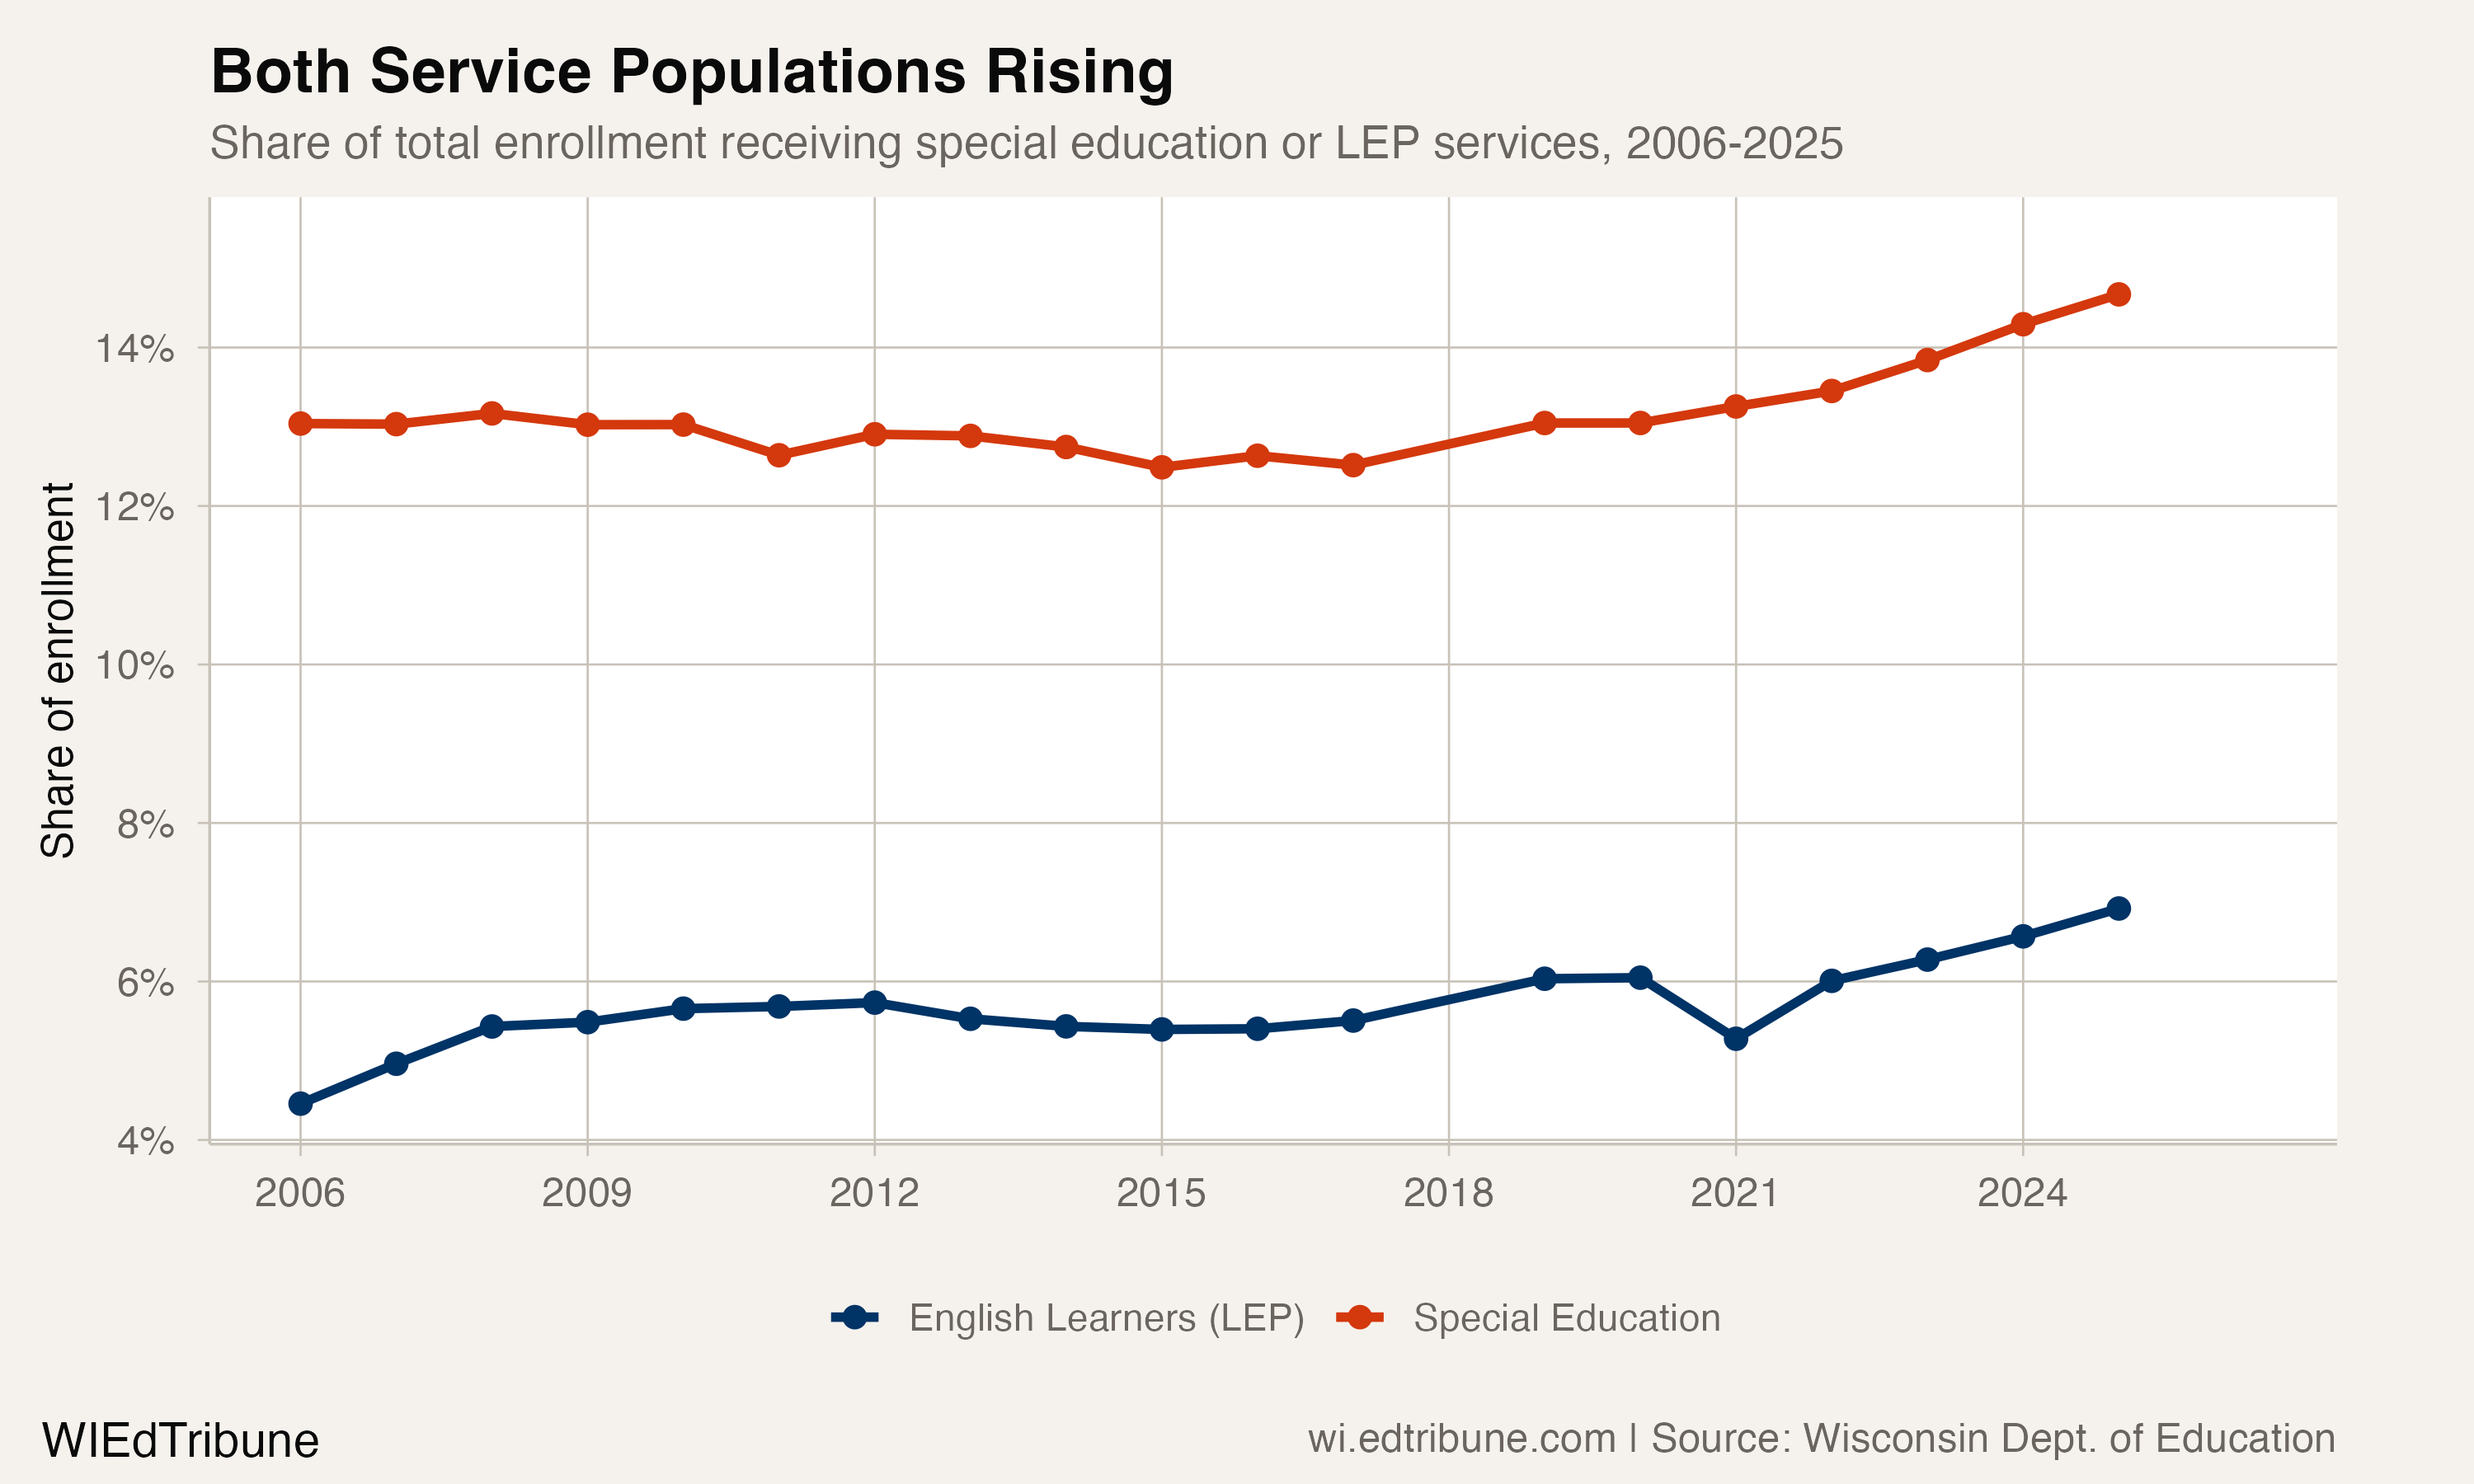
In 2006, special education accounted for 13.0% and English learners 4.5%. By 2025, those figures are 14.7% and 6.9% respectively. Because the categories overlap, the combined unduplicated figure is lower than their sum, but the directional pressure is clear: Wisconsin's public schools serve a student body that is increasingly entitled to specialized instruction, while the funding model was designed for a different era.
What to watch
The 2025-27 budget included an additional $504.7 million for special education categorical aid, the largest increase in recent memory. Whether that closes the gap depends on whether special education costs continue growing at 9% annually or moderate back toward the 4% the budget assumed. If the 14.7% share continues climbing at its recent pace of roughly 0.4 percentage points per year, Wisconsin will reach 1-in-6 by 2028. At that point, the structural mismatch between declining base enrollment and rising service obligations will be impossible for any referendum to bridge.
Detailed code that reproduces the analysis and figures in this article is available exclusively to EdTribune subscribers.
Discussion
Sign in to join the discussion.
Loading comments...